How to Build a Status Page for Your Self-Hosted Services with Gatus

Gatus is a single-binary or single-container monitoring tool that continuously probes your services and renders a public status page at a URL you control. You define every check in one YAML file, so your entire monitoring setup can live in Git alongside the rest of your infrastructure. There is no mandatory database, no web-based configuration UI to click through, and no per-monitor pricing. If you self-host anything - a blog, a Gitea instance, a Home Assistant server, a mail relay - Gatus gives you a straightforward way to know when something breaks and to show your users that things are running.
This guide walks through installing Gatus with Docker Compose, writing endpoint checks with its condition syntax, configuring alerts for downtime, and customizing the status page for public access.
Why Gatus Over Uptime Kuma, Statping, or Paid Services
The self-hosted monitoring space has a handful of well-known options, and the right pick depends on how you manage your infrastructure.
Uptime Kuma is the most popular choice, sitting at over 84,000 GitHub stars. It has a polished web UI where you add monitors through a browser, and it works well for people who prefer clicking over editing config files. The tradeoff is that all configuration lives in a SQLite database. You cannot version-control your monitor definitions, you cannot review changes in a pull request, and restoring a setup from backup means restoring the database file. If you treat your infrastructure as code - Terraform, Ansible, Docker Compose files checked into Git - Uptime Kuma’s approach feels like a gap in the pipeline.
Statping-ng was once a reasonable alternative, but its last meaningful commit landed in 2023. The project is effectively abandoned, and running unmaintained monitoring software creates the exact kind of reliability problem you are trying to solve.
Paid services like Pingdom, Better Uptime, and Checkly cost between $20 and $100 per month once you exceed a handful of monitors. They offer geographic distribution, synthetic browser testing, and incident management workflows that Gatus does not attempt. If you need Playwright-based synthetic checks from five continents with on-call rotation, a paid service or Grafana OnCall is the right tool. But for monitoring 20-80 endpoints from a single location on your own network, Gatus does the job without a subscription.
Gatus sits in a specific niche: configuration-as-code, minimal resource usage, flexible condition evaluation, and zero cost. It supports HTTP, TCP, DNS, ICMP, and SSH checks. It evaluates conditions against status codes, response times, response body content (including JSONPath), TLS certificate expiry, and DNS resolution results. It organizes endpoints into groups, exposes an API for uptime badges, and ships a built-in status page that auto-refreshes. Running on a Raspberry Pi 4 monitoring 50 endpoints every 60 seconds, it uses roughly 40 MB of RAM and negligible CPU.
| Feature | Gatus | Uptime Kuma | Paid (Checkly/Pingdom) |
|---|---|---|---|
| Configuration | YAML file (Git-friendly) | Web UI / SQLite DB | Web UI / API |
| Self-hosted | Yes | Yes | No |
| Protocol support | HTTP, TCP, DNS, ICMP, SSH | HTTP(s), TCP, ICMP, DNS | HTTP, browser synthetic |
| Alerting providers | 20+ (Slack, Discord, Ntfy, PagerDuty, etc.) | 90+ | Varies by vendor |
| Status page | Built-in | Built-in | Built-in |
| Resource usage | ~40 MB RAM for 50 endpoints | ~100-150 MB RAM | N/A (cloud) |
| Cost | Free | Free | $20-100+/month |
| Geo-distributed checks | No | No | Yes |
| Config version control | Native (YAML in Git) | Manual DB exports | API-based |
When Gatus is not the right choice: if you need synthetic browser monitoring, distributed checks from multiple geographic locations, or built-in incident management with on-call schedules, look elsewhere.
Installing and Configuring Gatus with Docker Compose
Gatus runs as a single container with one mounted configuration file. The current stable release is v5.34.0, distributed as twinproduction/gatus:latest on Docker Hub.
Create a project directory and add two files: docker-compose.yml and a configuration file at config/config.yaml.
# docker-compose.yml
services:
  gatus:
    image: twinproduction/gatus:v5.34.0
    container_name: gatus
    restart: unless-stopped
    ports:
      - "8080:8080"
    volumes:
      - ./config:/config:ro
      - gatus-data:/data
    environment:
      - TZ=America/New_York
      - SLACK_WEBHOOK_URL=${SLACK_WEBHOOK_URL}
      - DISCORD_WEBHOOK_URL=${DISCORD_WEBHOOK_URL}
    healthcheck:
      test: ["CMD", "wget", "--spider", "-q", "http://localhost:8080/health"]
      interval: 30s
      timeout: 5s
      retries: 3

volumes:
  gatus-data:
The config/config.yaml file is where all monitoring logic lives. Here is a minimal starting point:
storage:
  type: sqlite
  path: /data/gatus.db

ui:
  title: "Service Status"
  header: "Service Status"
  description: "Real-time availability of all services"

endpoints:
  - name: Blog
    group: Public
    url: "https://example.com"
    interval: 60s
    conditions:
      - "[STATUS] == 200"
      - "[RESPONSE_TIME] < 1000"
      - "[CERTIFICATE_EXPIRATION] > 168h"
The storage block enables persistent history. Without it, Gatus keeps check results in memory, and a container restart wipes everything. SQLite is the simplest option - Gatus creates the database file automatically. For larger deployments or when you want to query monitoring data from other tools, PostgreSQL is supported:
storage:
  type: postgres
  path: "postgres://gatus:password@postgres:5432/gatus?sslmode=disable"
Environment variable substitution works throughout the config file. Any ${ENV_VAR} reference is replaced at startup with the corresponding environment variable, which keeps secrets like webhook URLs out of your Git repository. Pass them through the environment block in Docker Compose or a .env file.
The healthcheck in the Compose file hits Gatus’s built-in /health endpoint. This lets Docker (or your orchestrator) know when Gatus itself is unhealthy. For production setups, consider monitoring Gatus from an external service or a second Gatus instance running on a different host - the “who watches the watchmen” problem.
Start the stack with docker compose up -d and open http://your-host:8080 to see the status page.
Configuring Endpoint Checks and Conditions
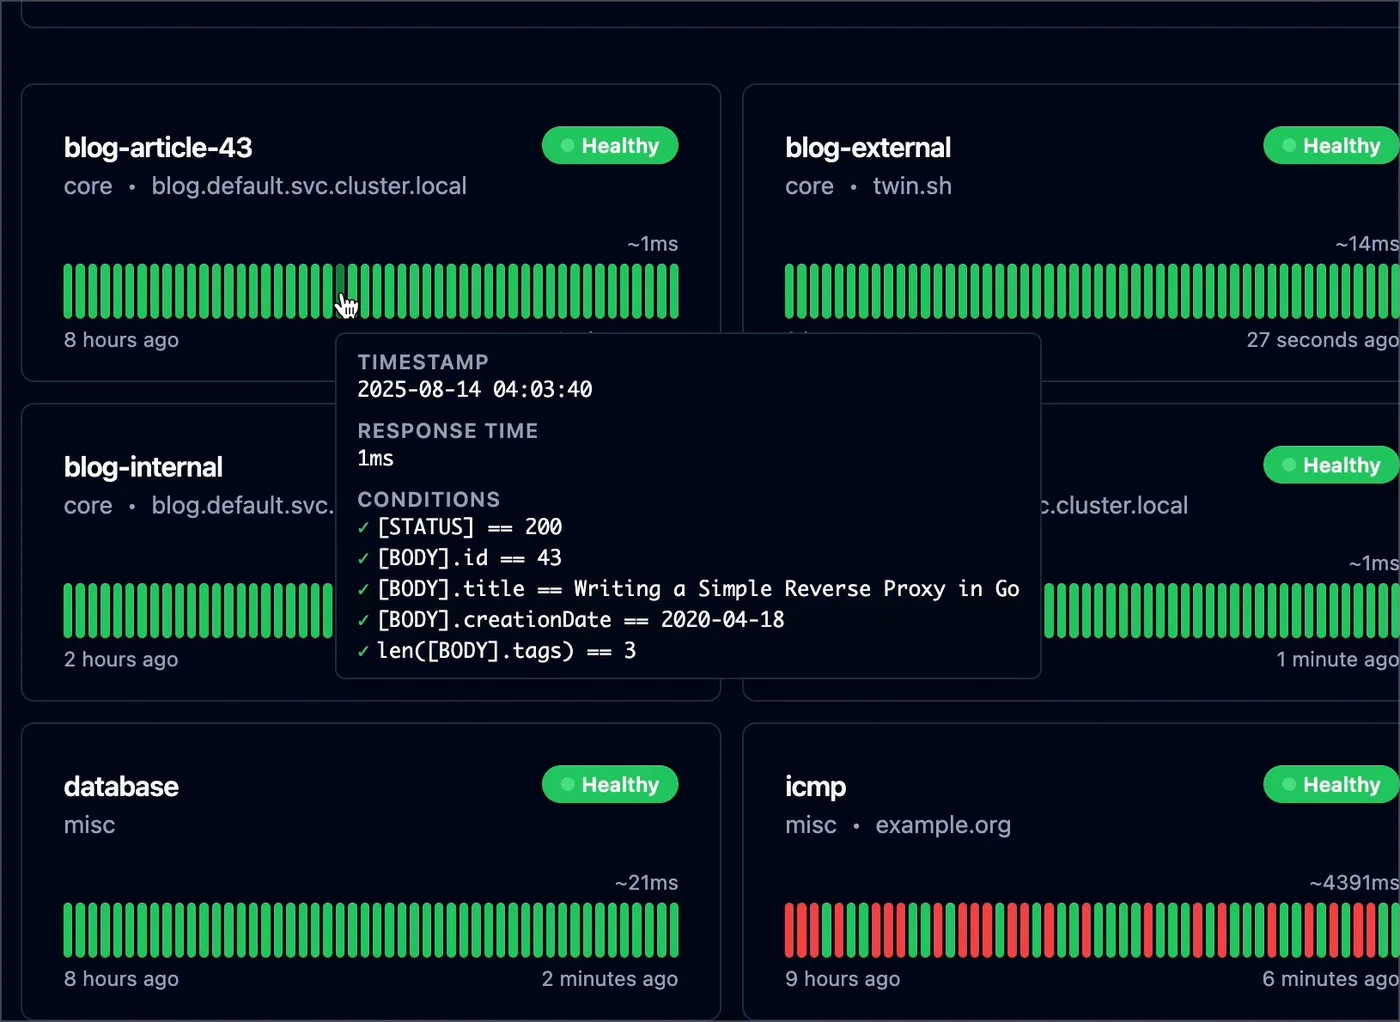
The condition system is where Gatus earns its reputation. Each endpoint defines a list of conditions using a bracketed syntax, and Gatus evaluates every condition on each check interval. If any condition fails, the endpoint is marked as unhealthy.
HTTP Checks
Most monitors will be HTTP checks against web applications and APIs:
endpoints:
  - name: API Health
    group: Backend
    url: "https://api.example.com/health"
    interval: 30s
    conditions:
      - "[STATUS] == 200"
      - "[BODY].status == ok"
      - "[RESPONSE_TIME] < 500"
Gatus automatically parses JSON response bodies when the content type is application/json. The [BODY].status syntax uses JSONPath to reach into the response. You can also use [BODY] == pat(*expected*) for pattern matching on non-JSON responses.
TCP Checks
TCP checks verify that a service is accepting connections on a given port, without caring about the protocol spoken on top:
  - name: PostgreSQL
    group: Infrastructure
    url: "tcp://db.example.com:5432"
    interval: 60s
    conditions:
      - "[CONNECTED] == true"
      - "[RESPONSE_TIME] < 100"
This is useful for databases, message brokers, and any service where you just need to confirm the port is open and responding quickly.
DNS Checks
DNS checks query a resolver and assert on the result, which is valuable for catching propagation issues after DNS changes:
  - name: DNS Resolution
    group: Infrastructure
    url: "dns://1.1.1.1"
    interval: 300s
    dns:
      query-name: "example.com"
      query-type: "A"
    conditions:
      - "[DNS_RCODE] == NOERROR"
      - "[BODY] == 93.184.216.34"
ICMP and SSH Checks
ICMP checks monitor network reachability for LAN devices:
  - name: Router
    group: Network
    url: "icmp://192.168.1.1"
    interval: 30s
    conditions:
      - "[CONNECTED] == true"
      - "[RESPONSE_TIME] < 10"

  - name: Jump Server SSH
    group: Infrastructure
    url: "ssh://server.example.com:22"
    interval: 120s
    conditions:
      - "[CONNECTED] == true"
Note that ICMP checks require Gatus to run with CAP_NET_RAW capability or as root. In Docker, add cap_add: [NET_RAW] to the service definition.
Endpoint Groups and Intervals
Organize endpoints into groups using the group field. The status page renders groups as collapsible sections. Set shorter intervals (30s) for critical public-facing services and longer intervals (300s) for less critical internal checks. Gatus staggers checks internally to avoid burst traffic. Keep intervals above 10 seconds to avoid tripping rate limits or being flagged by your own WAF.
Setting Up Alerts for Downtime and Degradation
A status page shows current and historical state, but you need push notifications to respond to outages before your users notice. Gatus supports over 20 alerting providers. Here are the most practical ones for a self-hosted setup.
Alert Trigger Behavior
Each endpoint can define multiple alert targets with independent thresholds:
endpoints:
- name: Blog
group: Public
url: "https://example.com"
interval: 60s
conditions:
- "[STATUS] == 200"
alerts:
- type: slack
failure-threshold: 3
success-threshold: 2
- type: discord
failure-threshold: 5
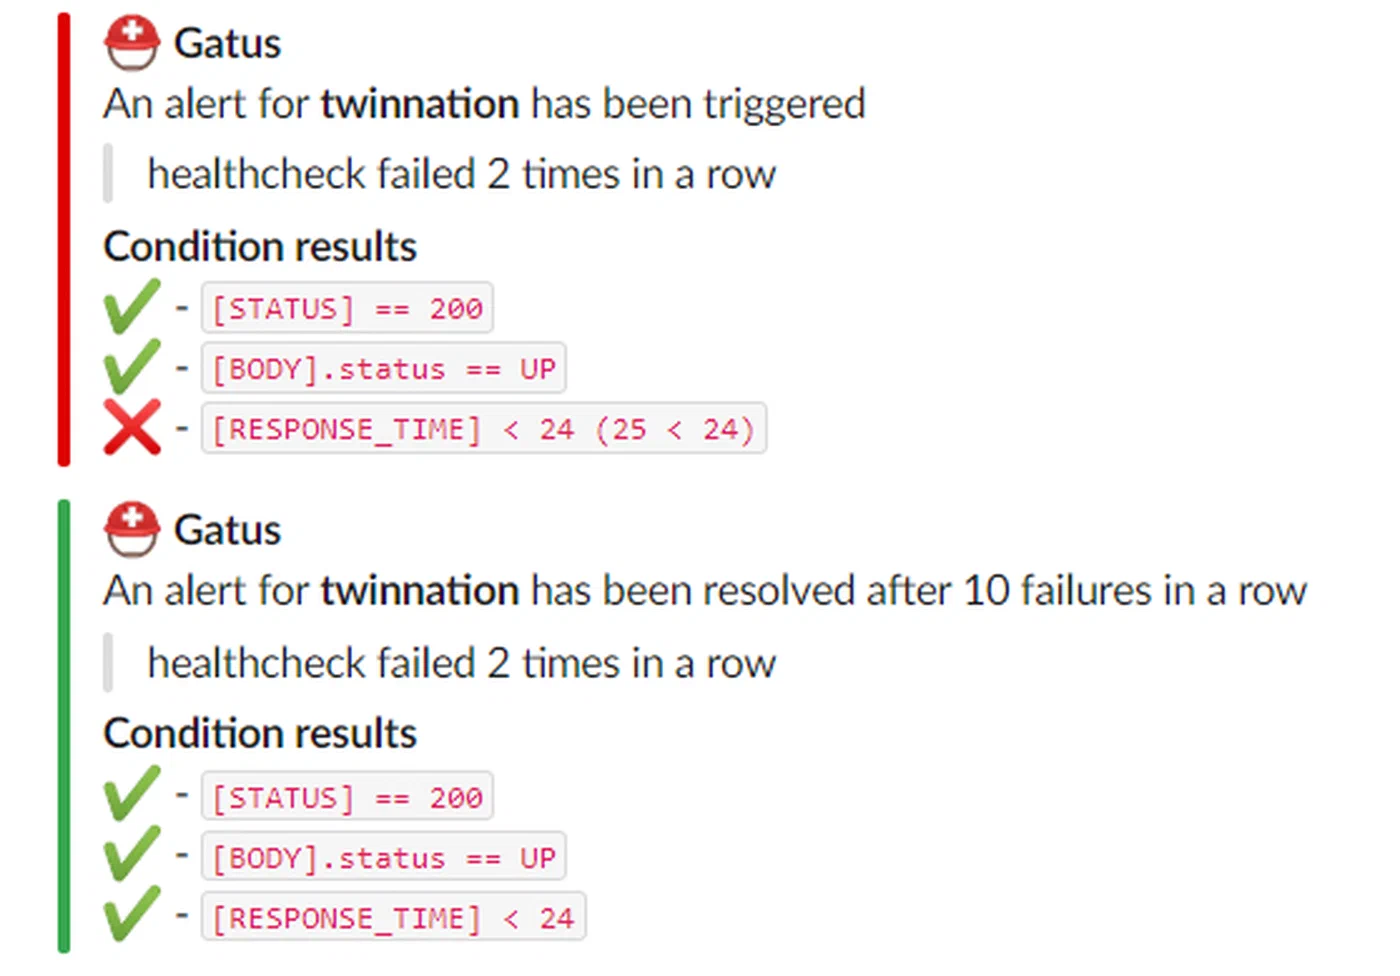
success-threshold: 3The failure-threshold controls how many consecutive failures must occur before an alert fires. Setting it to 3 means Gatus tolerates two transient failures before notifying you. The success-threshold controls how many consecutive successes are needed before sending a recovery notification. This prevents flapping - rapid alternation between alert and recovery messages during intermittent issues.
Gatus sends exactly one notification per state transition. It does not spam you on every failed check. A single “Blog is DOWN” message goes out when the threshold is crossed, and a single “Blog is UP” message follows once the endpoint recovers.
Configuring Notification Providers
Define providers in the alerting section of the config:
alerting:
  slack:
    webhook-url: "${SLACK_WEBHOOK_URL}"
    default-alert:
      failure-threshold: 3
      success-threshold: 2

  discord:
    webhook-url: "${DISCORD_WEBHOOK_URL}"

  ntfy:
    topic: "monitoring"
    url: "https://ntfy.example.com"
    priority: 4

  email:
    from: "gatus@example.com"
    host: "smtp.example.com"
    port: 587
    username: "${SMTP_USER}"
    password: "${SMTP_PASS}"
    to: "admin@example.com"
Ntfy
deserves special mention for self-hosted setups. It is a free, self-hostable push notification service that sends alerts directly to your phone. Gatus has native Ntfy support since v5.x, so you do not need the custom provider workaround anymore - just set the topic, url, and optional priority (1-5 scale, where 5 is urgent).
For Slack and Discord, create an incoming webhook in your workspace or server settings and pass the URL through an environment variable. Gatus formats the messages with endpoint name, URL, failed condition, and response time.
Email alerts serve as a fallback channel. If your Slack workspace or Discord server is also experiencing issues, email routed through a different provider can still reach you.
For teams running production workloads, PagerDuty integration is available:
alerting:
  pagerduty:
    integration-key: "${PAGERDUTY_KEY}"
Gatus sends PagerDuty events that trigger incident workflows, escalation policies, and on-call schedules.
Customizing the Status Page and Exposing It Publicly
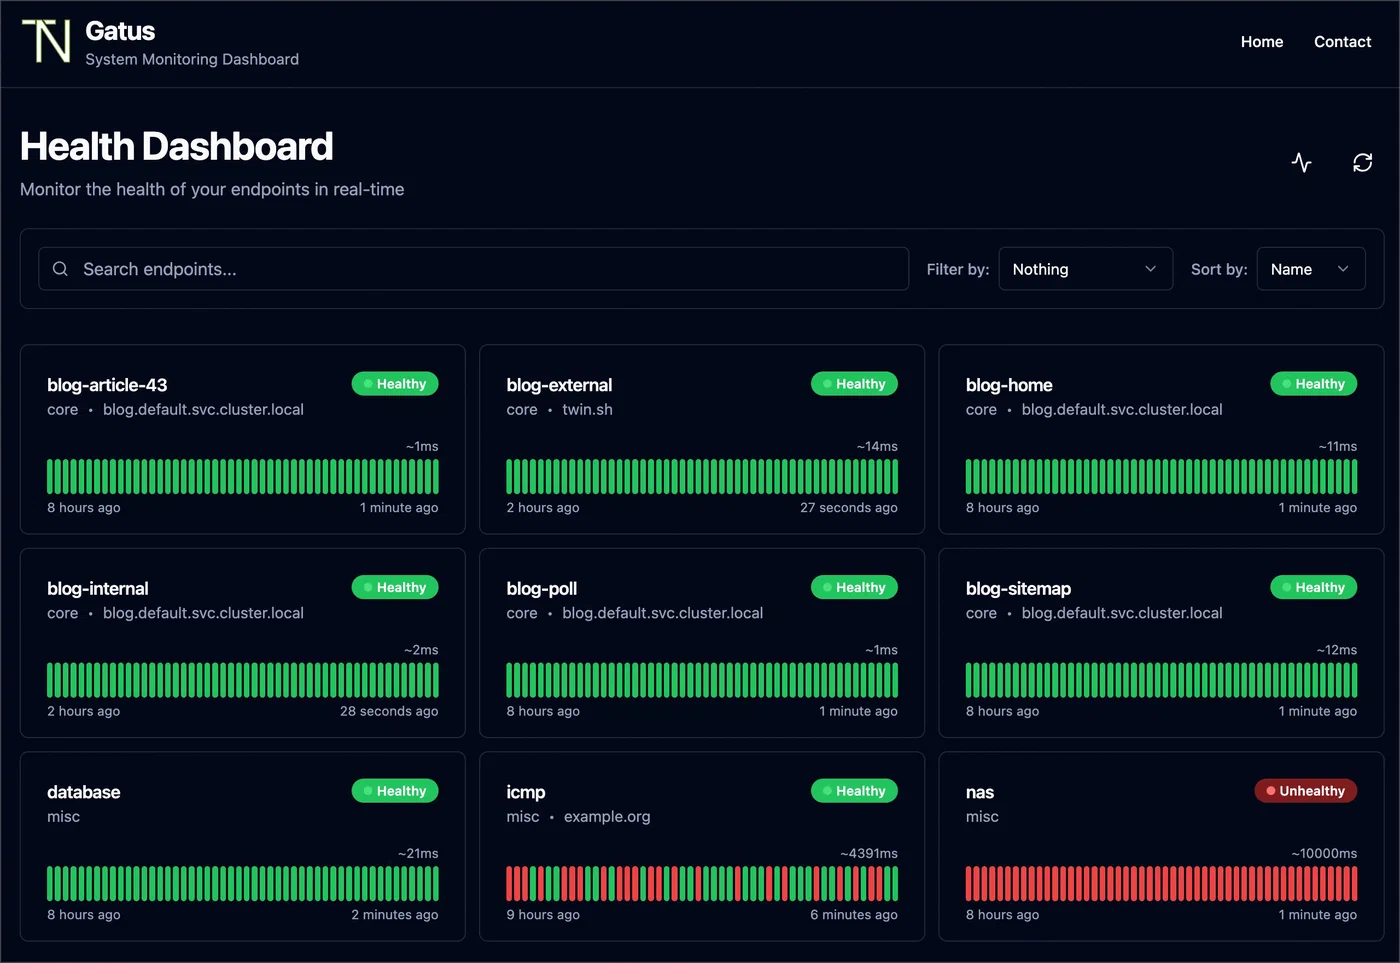
The built-in Gatus status page is clean and functional out of the box. It shows each endpoint grouped by category, with colored indicators for current status and a historical uptime graph when persistent storage is enabled.
UI Configuration
Customize the page appearance through the ui section:
ui:
  title: "Homelab Status"
  header: "Service Status"
  description: "Real-time availability of all homelab services"
  logo: "https://example.com/logo.png"
The page auto-refreshes every 60 seconds. With SQLite or PostgreSQL storage, the status page displays uptime percentages for the last 7 days and 30 days alongside response time graphs - exactly the kind of historical data that builds trust with users.
Status Badges
Gatus exposes badge endpoints that you can embed in GitHub READMEs, documentation sites, or blog sidebars:

The badge URL pattern is /api/v1/endpoints/{group}_{name}/uptimes/{duration}/badge.svg. Group and name are lowercased with spaces replaced by hyphens.
Public Exposure with a Reverse Proxy
For public-facing status pages, put Gatus behind a reverse proxy like Traefik or Nginx . With Traefik, add labels to the Docker Compose service:
services:
  gatus:
    labels:
      - "traefik.enable=true"
      - "traefik.http.routers.gatus.rule=Host(`status.example.com`)"
      - "traefik.http.routers.gatus.tls.certresolver=letsencrypt"
      - "traefik.http.services.gatus.loadbalancer.server.port=8080"
If you want to restrict access to certain API endpoints while keeping the status page public, configure path-based rules in your reverse proxy. The status page itself is served at /, while the API lives under /api/v1/.
Monitoring Internal Docker Services
One practical advantage of running Gatus in Docker is that it can reach other containers on the same Docker network by their service name. Instead of exposing ports to the host just for monitoring, create a shared Docker network:
networks:
  monitoring:
    external: true

services:
  gatus:
    networks:
      - monitoring
Then reference internal services in your endpoints:
endpoints:
  - name: Gitea
    group: Internal
    url: "http://gitea:3000"
    interval: 60s
    conditions:
      - "[STATUS] == 200"
This keeps your service ports unexposed to the host while still monitoring them.
Integrating Gatus with Prometheus and Grafana
Gatus exposes a /metrics endpoint in Prometheus format, which means you can scrape it with Prometheus
and build dashboards in Grafana
for long-term metrics retention and advanced visualization.
Add a Prometheus scrape target:
# prometheus.yml
scrape_configs:
  - job_name: gatus
    scrape_interval: 60s
    static_configs:
      - targets: ["gatus:8080"]
The metrics include endpoint health status, response times, and certificate expiration data. You can add custom labels to endpoints using the extra-labels field in the Gatus config for more flexible filtering in Grafana queries.
There is a community Gatus dashboard on Grafana Labs (dashboard ID 24379) that provides a ready-made visualization. Import it into your Grafana instance and point it at the Prometheus data source where Gatus metrics are stored.
This setup complements rather than replaces the built-in status page. The Gatus UI is for public consumption - a quick glance at whether services are up. The Grafana dashboard is for operators who want historical trends, correlation with other metrics, and custom alerting rules through Prometheus Alertmanager.
Practical Tips and Maintenance
A few things worth knowing after you have Gatus running.
Gatus does not have a built-in maintenance window feature. The simplest approach is to set enabled: false on an endpoint in the config file during planned downtime, then re-enable it afterward. If your config is in Git, this is just a commit and a container restart. You can automate this with a CI pipeline that modifies the YAML and restarts the container on a schedule.
The [CERTIFICATE_EXPIRATION] condition checks the leaf certificate only. If you need to monitor intermediate certificate expiry or full chain validation, you will need a separate tool or script.
Gatus validates the YAML configuration on startup and logs errors clearly. Get into the habit of checking docker logs gatus after any config change. A malformed YAML file will prevent Gatus from starting, which is better than silently running with a broken config.
At 50 endpoints with 60-second intervals, expect around 40 MB of RAM usage. Scaling to 200+ endpoints or using very short intervals (10-15 seconds) will increase resource consumption, but Gatus remains light compared to most monitoring stacks. It runs comfortably on a Raspberry Pi 4 or any low-end VPS.
If using SQLite storage, back up the /data/gatus.db file regularly. The check history it contains powers the uptime percentage displays on the status page. Losing it means starting over with no historical data.
Gatus fills a specific role well: it monitors your endpoints, tells you when something is wrong, and shows a status page to anyone who asks. It does not try to be a full observability platform. Combined with Prometheus and Grafana for metrics, and a log aggregator like Loki for logs, it forms one piece of a practical self-hosted monitoring stack that costs nothing and runs on hardware you already own.