Core Web Vitals: How to Fix LCP, CLS, and INP

To pass all three Core Web Vitals, target an LCP under 2.5 seconds by preloading your hero image and cutting server response time, a CLS under 0.1 by reserving explicit dimensions for all media, and an INP under 200ms by breaking long JavaScript tasks into smaller chunks. Diagnose all three using Chrome DevTools, Lighthouse, and the CrUX Dashboard for real-user field data.
Why Core Web Vitals Matter for SEO and User Experience
Google formally incorporated Core Web Vitals into its ranking algorithm in 2021, but their weight has grown since then. With the March 2026 core update, Google introduced holistic CWV scoring - performance data aggregated across your entire domain rather than judged page by page. If 30% of your indexed pages fail LCP thresholds, that drags down the site-wide score even if your homepage is fast.
Only 47% of sites currently reach Google’s “good” thresholds across all three metrics. The remaining 53% see measurable losses in conversions and organic traffic. In competitive niches, sites that fix all three metrics report 5-15% organic traffic improvement, largely because passing CWV unlocks a “Page Experience” badge in search results and increases click-through rate.
The three metrics measure distinct aspects of page quality:
| Metric | What It Measures | Good | Needs Improvement | Poor |
|---|---|---|---|---|
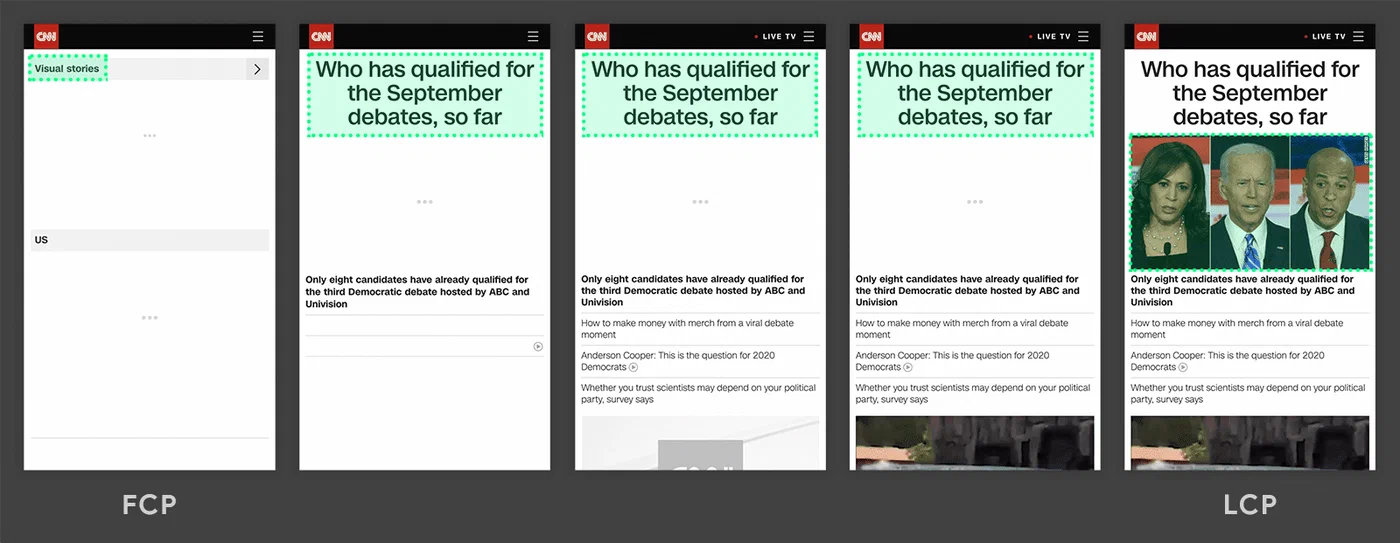
| LCP - Largest Contentful Paint | How long until the largest visible element renders | < 2.5s | 2.5s - 4.0s | > 4.0s |
| CLS - Cumulative Layout Shift | Total unexpected visual movement during page load | < 0.1 | 0.1 - 0.25 | > 0.25 |
| INP - Interaction to Next Paint | Latency from user interaction to visual update | < 200ms | 200ms - 500ms | > 500ms |
One important distinction: Lighthouse and PageSpeed Insights show lab data (simulated conditions), but Google uses field data from real Chrome users for ranking purposes. A page can score 100 in Lighthouse but still fail CWV in field data because real-world devices and mobile connections are far slower than Lighthouse’s test environment. Use Google Search Console and the CrUX Dashboard for field data alongside Lighthouse for lab diagnostics.
Fixing LCP: Preload Critical Resources and Cut Server Response Time
LCP failures trace back to four causes: slow server response, render-blocking resources, slow resource load time for the LCP element itself, or client-side rendering delays. Work through them in order of impact.
Start with Time to First Byte (TTFB). If your TTFB exceeds 800ms, no amount of frontend optimization will produce a good LCP. Test it with:
curl -w "TTFB: %{time_starttransfer}\n" -o /dev/null -s https://yoursite.comFixes depend on your stack: upgrade to faster hosting, enable server-side caching (Redis or Varnish), or route traffic through a CDN like Cloudflare, Fastly, or BunnyCDN to serve responses from an edge node closer to your users.
Preloading the LCP image is the highest-impact frontend change for most sites. Add to your <head>:
<link rel="preload" as="image" href="hero.webp" fetchpriority="high">Without this, the browser discovers your hero image only after parsing the full HTML document and CSS - potentially hundreds of milliseconds after navigation starts. For responsive images, use imagesrcset and imagesizes attributes on the preload link.
Set loading="lazy" on all images except the LCP image. The LCP image should load eagerly with fetchpriority="high". Setting loading="lazy" on the hero image is a very common mistake that pushes LCP beyond 4 seconds.
Render-blocking CSS is the next target. Inline critical above-the-fold styles directly in a <style> tag in <head>. Tools like the critical
npm package or Penthouse extract only the CSS needed for the initial viewport. Load the full stylesheet asynchronously:
<link rel="preload" href="style.css" as="style" onload="this.onload=null;this.rel='stylesheet'">Image format and size matter too. WebP reduces file size 30-50% compared to JPEG at equivalent quality; AVIF goes further. Use responsive images with srcset and sizes to avoid serving full desktop-sized images to mobile devices.
When text content is the largest element, custom font loading can delay LCP. Use font-display: swap to prevent invisible text while fonts load, and preload critical fonts:
<link rel="preload" as="font" href="font.woff2" type="font/woff2" crossorigin>Consider using system font stacks for body text and reserving custom fonts for headings only.
Fixing CLS: Reserve Space and Keep Content Stable
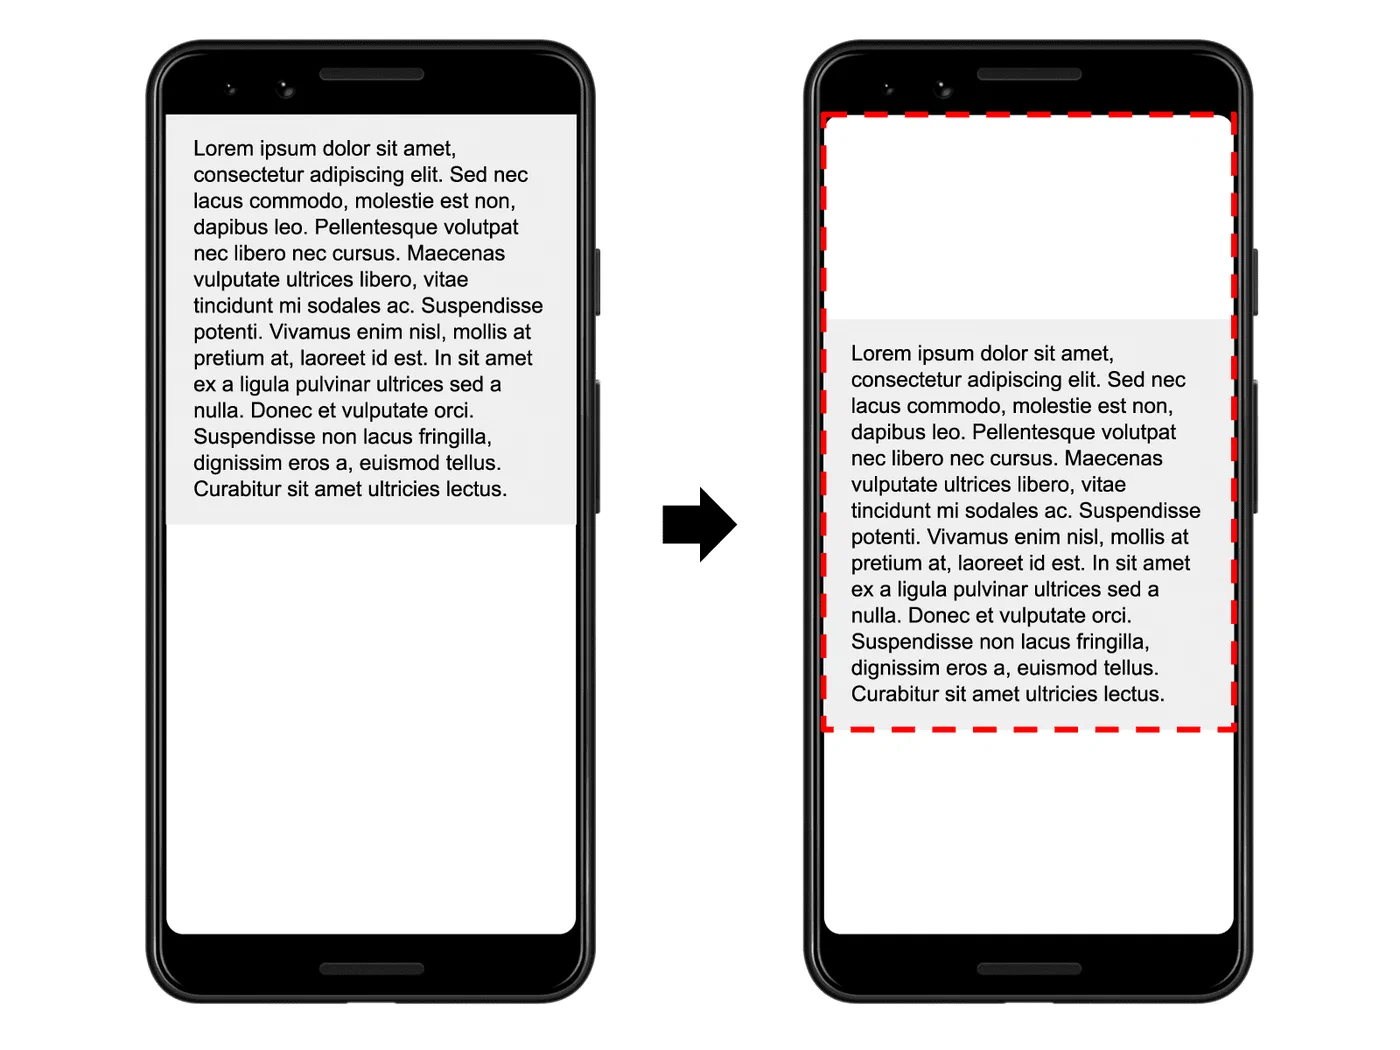
Layout shifts happen when the browser places content on screen before it knows the final dimensions of nearby elements. The most common culprits are images without explicit dimensions, dynamically loaded ads, and injected UI elements like cookie banners.
Always set width and height attributes on images and videos. Modern browsers use these to calculate the aspect ratio before the content loads, reserving the correct space in the layout:
<img src="photo.jpg" width="1200" height="800" alt="Description">Pair this with CSS max-width: 100%; height: auto; and the image will scale responsively while the browser holds the correct space.
For embedded content like YouTube videos, Google Maps, or other iframes, use the CSS aspect-ratio property. Wrap the embed in a container:
.video-wrapper {
  aspect-ratio: 16 / 9;
  width: 100%;
}
This replaces the older padding-bottom percentage hack and works cleanly with modern browsers.
Ad containers need minimum height. Dynamically loaded ads are the leading cause of CLS on content sites. Reserve space with min-height on ad container elements matching your most common ad sizes - for example, min-height: 250px for a standard 300x250 medium rectangle. The space will already exist in the layout when the ad loads.
Avoid injecting content above existing content. Notification bars, cookie consent banners, and dynamic headers that push page content downward cause significant CLS. Use position: fixed or position: sticky for banners so they overlay content rather than displace it. If you must inject content dynamically, insert it below the fold.
Web font CLS occurs when a custom font has different metrics than the fallback system font, causing text to reflow when the custom font loads. The size-adjust, ascent-override, and descent-override CSS properties let you tune your fallback font to match the custom font’s metrics, eliminating visible reflow. Alternatively, font-display: optional skips the custom font entirely for users without it cached - zero reflow risk at the cost of the first-visit custom font experience.
To debug CLS, open the Chrome DevTools Performance panel, record a page load, and look for “Layout Shift” entries in the timeline. Each entry highlights shifted elements in blue. You can also log individual shifts programmatically:
new PerformanceObserver((list) => {
  for (const entry of list.getEntries()) {
    if (!entry.hadRecentInput) {
      console.log('Layout shift:', entry.value, entry.sources);
    }
  }
}).observe({ type: 'layout-shift', buffered: true });
Fixing INP: Unblock the Main Thread
INP replaced FID (First Input Delay) in March 2024 and is currently the most commonly failed Core Web Vital - 43% of sites fail the 200ms threshold. Unlike FID, which only measured the delay on the very first user interaction, INP tracks all interactions throughout the page lifecycle and reports the worst one at the 98th percentile. A single slow button handler can fail the entire metric.
The root cause is almost always a blocked main thread. The browser uses a single thread for JavaScript execution, layout, paint, and responding to user input. When a JavaScript function takes 200ms+ to run, any interactions queued during that time wait until the long task completes.

To find the culprit, open Chrome DevTools, go to the Performance panel, interact with the page, and look for yellow “Long Task” blocks (over 50ms) on the main thread. Click a block to see the call stack. The function at the bottom is almost always where the time goes.
Break long tasks with scheduler.yield(), available in Chrome and Firefox since mid-2025:
async function processLargeDataset(items) {
  for (let i = 0; i < items.length; i++) {
    processItem(items[i]);
    if (i % 50 === 0) {
      await scheduler.yield(); // give the browser a chance to handle input
    }
  }
}
The key advantage over setTimeout(fn, 0) is that scheduler.yield() prioritizes the continuation of the current task over other pending tasks from different sources. Your code picks up right where it left off after yielding, but the browser can respond to a pending click or keypress in between.
For browsers that don’t yet support the Scheduler API, the fallback is setTimeout:
await new Promise(resolve => setTimeout(resolve, 0));Use requestIdleCallback() for non-urgent work. Analytics logging, prefetching, and off-screen DOM updates don’t need to run during active user interaction. Defer them:
requestIdleCallback(() => {
  sendAnalytics();
  prefetchNextPage();
}, { timeout: 2000 });
The timeout option ensures the callback runs within 2 seconds even if the browser never goes fully idle.
Show immediate visual feedback when a user interaction triggers heavy work. Disabling a button or showing a loading spinner before the computation starts is enough to make the interaction feel responsive, even if the work itself takes time:
button.addEventListener('click', async () => {
  button.disabled = true;
  button.textContent = 'Processing...';
  await scheduler.yield();
  await heavyComputation();
  button.disabled = false;
});
Third-party scripts - analytics, chat widgets, ad networks - frequently add 100-300ms of main thread blocking. Load them with async or defer. For the worst offenders, Partytown
moves third-party script execution into a web worker entirely, freeing the main thread for user interactions. Note that Partytown is still in beta and not guaranteed to work with every analytics vendor.
When pages render large lists, virtual scrolling matters. Rendering 1,000+ DOM nodes causes slow re-layout on every interaction that touches the list. Libraries like TanStack Virtual
render only the visible rows, reducing INP from seconds to milliseconds for list-heavy interfaces. The native CSS alternative, content-visibility: auto combined with contain-intrinsic-size, achieves similar results without a JavaScript dependency.
Measuring Real-User Core Web Vitals
Google Search Console’s Core Web Vitals report shows field data from Chrome users segmented by URL group. For per-page field data, Google’s CrUX Dashboard shows historical trends broken down by device category.
To capture your own real-user data, use the web-vitals JavaScript library (currently version 5.2.0):
import { onLCP, onCLS, onINP } from 'web-vitals';

onLCP(({ name, value, rating }) => sendToAnalytics({ name, value, rating }));
onCLS(({ name, value, rating }) => sendToAnalytics({ name, value, rating }));
onINP(({ name, value, rating }) => sendToAnalytics({ name, value, rating }));
The rating field is 'good', 'needs-improvement', or 'poor' based on the official thresholds, making it easy to filter your analytics by pages failing each metric.
Mobile field data is typically much worse than desktop. Real users on mid-range Android devices on 4G connections regularly see LCP 2-3x higher than the same page in a desktop Lighthouse test. When triaging, filter your CrUX and Search Console data by phone device category to see the numbers Google is actually using for mobile ranking.