How to Benchmark Your SSD on Linux: NVMe Gen5 Performance

To properly benchmark your SSD on Linux, use fio for comprehensive sequential and random I/O testing, hdparm for a quick sequential read sanity check, and GNOME Disks for a visual one-click benchmark. A healthy Gen5 NVMe drive — a Crucial T705, Samsung 990 EVO Plus Gen5, or WD Black SN8100 — should deliver 12,000-14,000 MB/s sequential reads and over 1,200,000 random 4K read IOPS. Gen4 drives top out around 7,000 MB/s sequential and 800,000-1,000,000 IOPS. If your numbers fall significantly short of those targets, there is usually a diagnosable reason: thermal throttling, a PCIe slot running at the wrong generation, or an I/O scheduler misconfiguration.
This guide covers the full benchmarking stack from a 30-second sanity check to a four-test fio suite, explains what the numbers mean in real-world terms, and sets up automated monitoring to catch drive degradation before it becomes data loss.
Why and When to Benchmark Your SSD
Benchmarking is not just for verifying marketing claims or winning forum arguments. There are several practical reasons to measure your drive’s performance, and knowing which situation you are in determines which tool to reach for.
Establishing a baseline after installation gives you a reference point to compare against later. SSDs degrade over their lifetime as NAND cells wear and the drive’s firmware compensates with more error correction overhead. A drive delivering 7,000 MB/s sequential reads on day one should still be close to that number two years later. If it is down to 5,500 MB/s, something worth investigating has happened.
Pre- and post-change comparisons are the most common reason developers benchmark drives. Enabling LUKS full-disk encryption adds 10-20% overhead on write operations. Switching from ext4 to Btrfs with compression changes the effective throughput profile. Changing the kernel I/O scheduler from none to mq-deadline or bfq affects latency distribution. Benchmarking before and after each change shows whether the tradeoff is acceptable.
Verifying manufacturer specifications matters because drive reviews are predominantly conducted on Windows with Samsung Magician or Crystal DiskMark. Linux performance can differ due to driver maturity, NVMe firmware quirks, or kernel scheduler defaults. Your drive may perform differently under Linux than the review you read before buying it suggested.
Diagnosing thermal throttling is increasingly important with Gen5 drives. These drives draw 8-12W under sustained load, generate substantial heat, and will throttle down dramatically without adequate heatsinking. A drive that hits 13,000 MB/s for 10 seconds and then drops to 4,000 MB/s is throttling. Benchmarking with temperature monitoring in parallel reveals this quickly.
Before running any benchmark, check drive health with smartctl:
sudo apt install smartmontools  # if not already installed
sudo smartctl -a /dev/nvme0
Look at the Percentage Used field (alert if above 90%), Available Spare (alert below 10%), and Critical Warning (any non-zero value is bad). Benchmarking a failing drive produces misleading results and wastes time.
Quick Benchmarking with hdparm and GNOME Disks
Not every benchmark session requires a full fio suite. These two tools give you a meaningful performance snapshot in under 60 seconds, which is sufficient for quick health checks and casual before/after comparisons.
hdparm is available on virtually every Linux system and requires no configuration:
sudo hdparm -Tt /dev/nvme0n1The -T flag tests cached (RAM/CPU) read speed — this is measuring your memory subsystem, not your drive. The -t flag tests buffered disk reads. On a healthy Gen5 NVMe you will see something like:
/dev/nvme0n1:
 Timing cached reads:   56322 MB in  2.00 seconds = 28185.42 MB/sec
 Timing buffered disk reads: 9538 MB in  3.00 seconds = 3179.13 MB/sec
That 3,179 MB/s buffered read figure is well below the drive’s actual 13,000 MB/s capability, and that is expected. hdparm uses a single thread with a single I/O operation queued at a time. NVMe drives are designed for massive parallelism — hundreds of queued operations across multiple CPU cores. hdparm cannot saturate an NVMe controller by design. Treat it as a sanity check: if hdparm shows 200 MB/s on a Gen5 drive, something is severely wrong. If it shows 3,000-5,000 MB/s, the drive is probably healthy. Do not use it to compare Gen4 against Gen5.
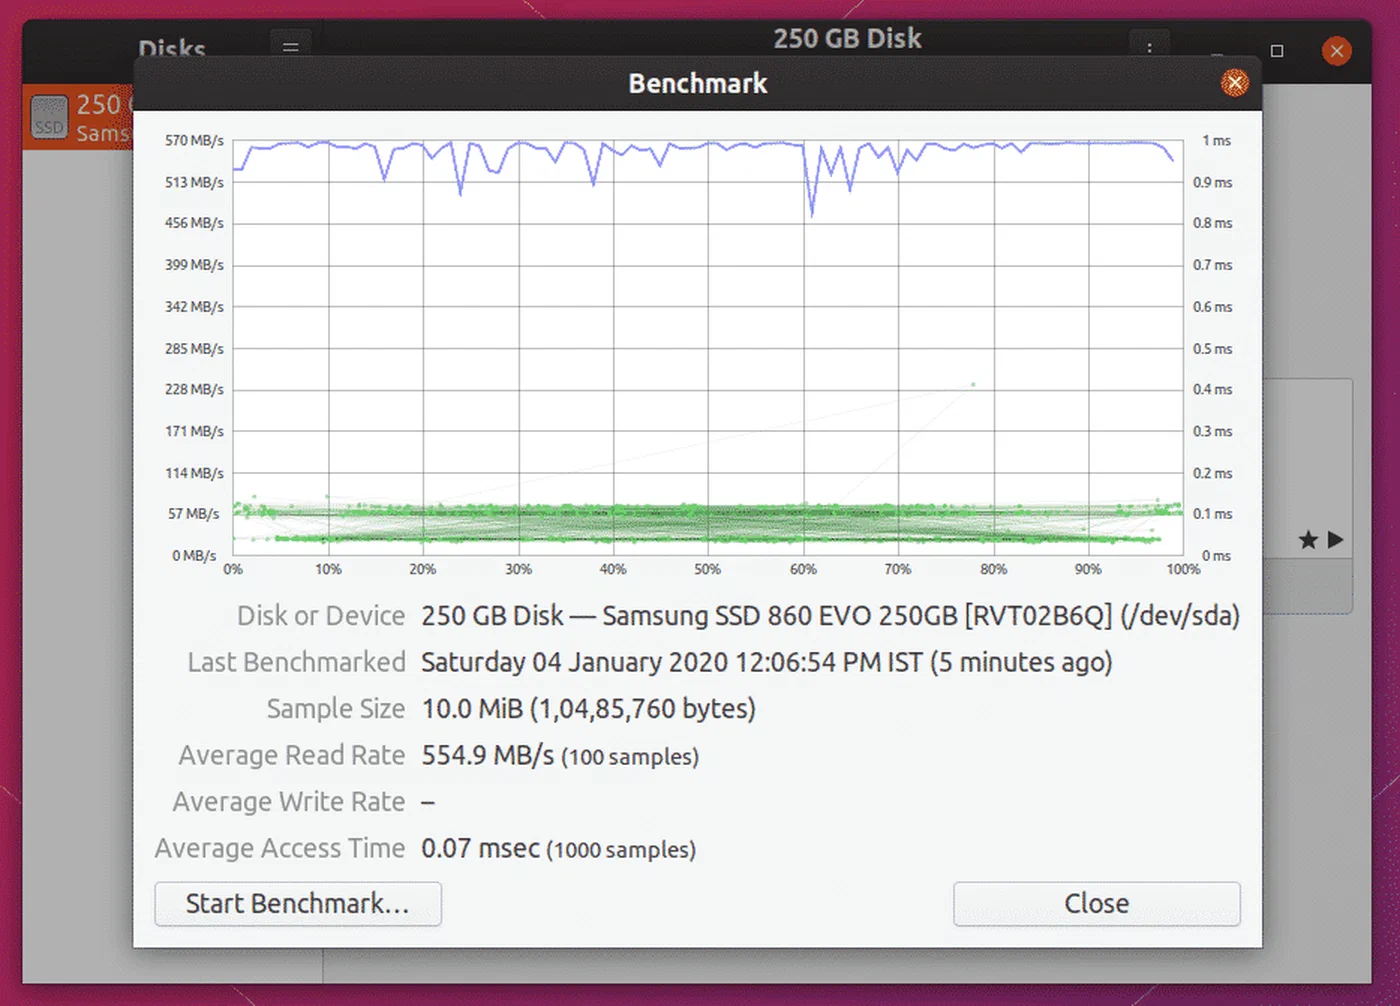
GNOME Disks provides a proper multi-sample sequential benchmark with a visual throughput graph:
gnome-disks # or launch from your application menuSelect your NVMe drive from the left panel, click the gear icon, and choose “Benchmark Disk.” Configure the settings:
- Transfer rate sample size: 1 GiB is the minimum worth taking seriously
- Number of samples: 10 or more for a stable average
- Read-only or read-write: write tests require an unmounted partition or free space; for production drives, stick to read-only
GNOME Disks uses direct I/O (O_DIRECT) to bypass the Linux page cache, so it is measuring actual drive performance rather than cached reads. It runs fine outside of GNOME — KDE and other desktop users can install it from their package manager and run it without pulling in full GNOME dependencies.
One quick check before running any benchmark: verify which I/O scheduler is active for your NVMe device:
cat /sys/block/nvme0n1/queue/schedulerFor NVMe drives, none is typically shown as [none] and means requests pass directly to the hardware queue without a kernel scheduler layer. This is usually the correct setting. If you see mq-deadline or another scheduler listed as active (in brackets), switching to none may improve raw throughput:
echo none | sudo tee /sys/block/nvme0n1/queue/schedulerComprehensive Benchmarking with fio
fio (Flexible I/O Tester) is the industry standard for storage benchmarking on Linux. It supports every I/O pattern you need to characterize a drive, outputs structured JSON for scripted analysis, and generates the queue depth and parallelism necessary to actually saturate NVMe hardware.
Install fio from your distribution’s package manager:
# Debian/Ubuntu
sudo apt install fio

# Fedora
sudo dnf install fio

# Arch Linux
sudo pacman -S fio
Version 3.36+ (current as of 2026) includes support for io_uring passthrough, which is the preferred I/O engine for NVMe testing. All commands below use --ioengine=io_uring.
Important safety note: the write tests below will overwrite data. Either point fio at an empty partition, a dedicated test file on an empty filesystem, or use the --filename=/path/to/testfile option to create a test file without touching existing data. Never run write tests against partitions containing data you want to keep.
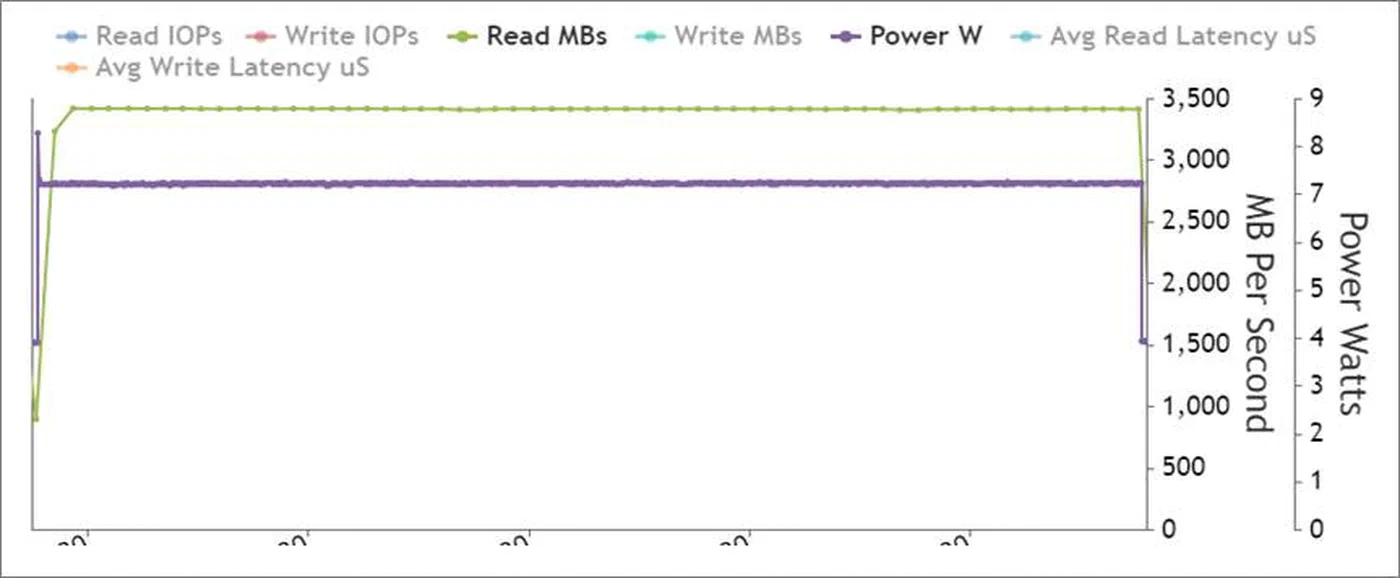
Sequential Read
fio --name=seq-read \
    --rw=read \
    --bs=1M \
    --size=4G \
    --numjobs=4 \
    --iodepth=64 \
    --ioengine=io_uring \
    --direct=1 \
    --group_reporting
This test saturates the NVMe controller with large-block sequential reads using four parallel jobs and a queue depth of 64 operations. Expected results: 12,000-14,000 MB/s on Gen5, 6,500-7,000 MB/s on Gen4, 3,000-3,500 MB/s on Gen3.
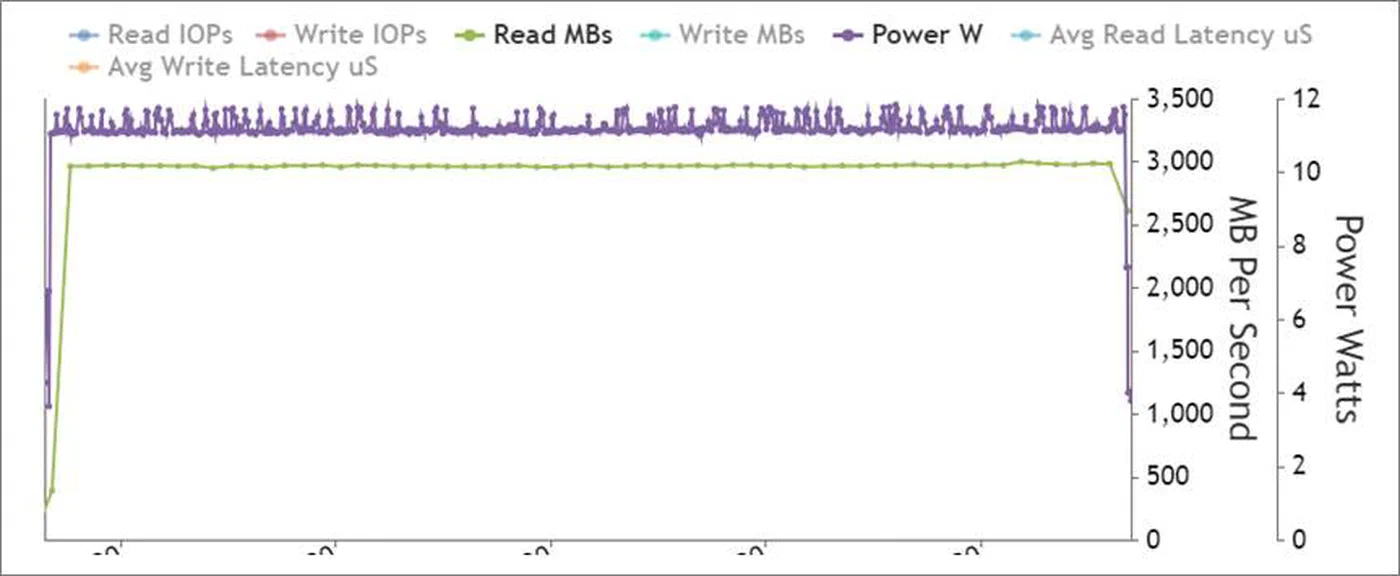
Sequential Write
fio --name=seq-write \
    --rw=write \
    --bs=1M \
    --size=4G \
    --numjobs=4 \
    --iodepth=64 \
    --ioengine=io_uring \
    --direct=1 \
    --group_reporting
Sequential write speed is where budget Gen5 drives often reveal their compromises. Drives with large SLC write caches (50-200GB) hit peak speeds during the test at 4GB size. Increase --size=256G to exhaust the SLC cache and measure sustained write speed. Many Gen5 drives drop from 12,000 MB/s peak to 3,000-5,000 MB/s sustained once the cache fills. This is expected behavior, but important to know if your workload involves sustained large writes (VM image transfers, video editing).
Random 4K Read (Queue Depth 32)
fio --name=rand-read \
    --rw=randread \
    --bs=4k \
    --size=1G \
    --numjobs=4 \
    --iodepth=32 \
    --ioengine=io_uring \
    --direct=1 \
    --group_reporting
This is the most practically important test for everyday workloads. Random 4K IOPS determines how fast your drive responds during package compilation, container image extraction, database queries, and application startup. Expected: 1,200,000+ IOPS on Gen5, 700,000-1,000,000 IOPS on Gen4, 400,000-600,000 IOPS on Gen3.
Random 4K Mixed Read/Write (70/30)
fio --name=rand-mixed \
    --rw=randrw \
    --rwmixread=70 \
    --bs=4k \
    --size=1G \
    --numjobs=4 \
    --iodepth=32 \
    --ioengine=io_uring \
    --direct=1 \
    --group_reporting
This simulates database and development workloads where reads dominate but writes are constant. The 70/30 read/write mix is a standard workload model (JESD219 Annex D). Results will be lower than the pure read test on both reads and writes — this is expected. The combined IOPS figure is the meaningful metric here.
Key parameter explanations:
--direct=1bypasses the Linux page cache. Without this, you are measuring RAM speed after the first pass. Always use--direct=1for drive benchmarking.--ioengine=io_uringuses the modern kernel async I/O interface introduced in Linux 5.1. It is faster and has lower CPU overhead thanlibaio. If your kernel is older than 5.1, use--ioengine=libaioinstead.--iodepth=64queues 64 operations simultaneously. NVMe supports up to 65,535 commands per queue and up to 65,535 queues. Saturating the controller requires enough depth to keep it busy.--numjobs=4creates four independent processes, each with their owniodepth=64queue. Total outstanding operations: 256. This is sufficient to saturate most NVMe controllers.
Interpreting Results: Gen4 vs. Gen5 Expected Performance
Raw benchmark numbers need context. Here are the expected performance ranges for popular drives, plus a diagnostic guide for results that fall short.
Reference Ranges
Gen5 NVMe (Crucial T705, Samsung 990 EVO Plus Gen5, WD Black SN8100):
- Sequential read: 12,000-14,400 MB/s
- Sequential write: 11,000-12,500 MB/s
- Random 4K read: 1,200,000-1,500,000 IOPS
- Random 4K write: 1,400,000-1,600,000 IOPS
Gen4 NVMe (Samsung 990 Pro, WD Black SN850X, Crucial T500):
- Sequential read: 6,500-7,450 MB/s
- Sequential write: 6,000-6,900 MB/s
- Random 4K read: 800,000-1,000,000 IOPS
- Random 4K write: 900,000-1,200,000 IOPS
Gen3 NVMe (Samsung 970 EVO Plus, WD Black SN750):
- Sequential read: 3,000-3,500 MB/s
- Sequential write: 2,500-3,300 MB/s
- Random 4K read: 400,000-600,000 IOPS
Diagnosing Below-Expected Results
Thermal throttling is the most common cause of poor Gen5 performance. Check the drive temperature during the benchmark:
sudo nvme smart-log /dev/nvme0 | grep temperatureMost Gen5 drives begin throttling at 70-75°C and will throttle aggressively at 80°C. If you see temperatures in this range, the drive needs better airflow or a heatsink. Heatsinks for M.2 drives range from $5 to $25 and uniformly improve sustained performance.
PCIe link speed mismatch is the second most common cause. A Gen5 NVMe drive installed in a Gen3 M.2 slot will deliver Gen3 performance regardless of its specifications. Verify the actual link speed:
sudo lspci -vv | grep -A 20 "Non-Volatile"Look for LnkSta: in the output. It should show Speed 32GT/s for Gen5 (PCIe 5.0), 16GT/s for Gen4, or 8GT/s for Gen3. If it shows a lower speed than expected, the slot or CPU does not support the drive’s generation. Consult your motherboard manual — many boards have multiple M.2 slots running at different PCIe generations.
Power management throttling can be checked with:
cat /sys/class/nvme/nvme0/power_stateIf the drive is in a low-power state, the kernel or firmware is throttling it. This is more common on laptops with aggressive power management enabled.
Filesystem overhead adds 5-15% latency compared to raw block device benchmarks. Benchmarking against the raw device (/dev/nvme0n1) will show higher numbers than benchmarking against a mounted filesystem. ext4 and XFS add minimal overhead. Btrfs with transparent compression enabled adds 10-30% write overhead but can increase effective throughput for compressible data by reducing the actual bytes written. ZFS has similar characteristics.
Automation and Continuous Monitoring
A one-time benchmark tells you where your drive stands today. Periodic monitoring catches the slow degradation that precedes drive failure and lets you replace a drive before data loss rather than after.
Automated Benchmark Logging
Create a benchmark script that runs the four fio tests, parses their JSON output, and appends results to a CSV log:
#!/bin/bash
# /usr/local/bin/ssd-benchmark.sh
DEVICE=${1:-/dev/nvme0n1}
TIMESTAMP=$(date +%Y-%m-%dT%H:%M:%S)
LOG=/var/log/ssd-benchmark.csv
TESTDIR=/tmp/fio-test
mkdir -p $TESTDIR

run_fio() {
    local name=$1
    local rw=$2
    local bs=$3
    fio --name=$name --rw=$rw --bs=$bs --size=2G \
        --numjobs=4 --iodepth=32 --ioengine=io_uring \
        --direct=1 --group_reporting --output-format=json \
        --filename=$TESTDIR/fio-testfile 2>/dev/null \
    | python3 -c "
import json,sys
d=json.load(sys.stdin)
j=d['jobs'][0]
bw=j['read']['bw']+j['write']['bw']
iops=j['read']['iops']+j['write']['iops']
print(f'{bw},{iops}')
"
}

SEQ_READ=$(run_fio seq-read read 1M)
SEQ_WRITE=$(run_fio seq-write write 1M)
RAND_READ=$(run_fio rand-read randread 4k)
RAND_MIXED=$(run_fio rand-mixed randrw 4k)

echo "$TIMESTAMP,$SEQ_READ,$SEQ_WRITE,$RAND_READ,$RAND_MIXED" >> $LOG
echo "Benchmark complete. Results appended to $LOG"
rm -rf $TESTDIR
Make it executable and run it:
sudo chmod +x /usr/local/bin/ssd-benchmark.sh
sudo /usr/local/bin/ssd-benchmark.sh
Scheduling Monthly Benchmarks with systemd
Create a systemd service and timer to run the benchmark automatically:
# /etc/systemd/system/ssd-benchmark.service
[Unit]
Description=Monthly SSD benchmark

[Service]
Type=oneshot
ExecStart=/usr/local/bin/ssd-benchmark.sh /dev/nvme0n1
# /etc/systemd/system/ssd-benchmark.timer
[Unit]
Description=Run SSD benchmark monthly
[Timer]
OnCalendar=monthly
Persistent=true
[Install]
WantedBy=timers.targetEnable the timer:
sudo systemctl daemon-reload
sudo systemctl enable --now ssd-benchmark.timer
SMART Monitoring with smartd
Configure smartd for continuous NVMe health monitoring. Edit /etc/smartd.conf:
# Monitor all NVMe drives, check daily, email on critical issues
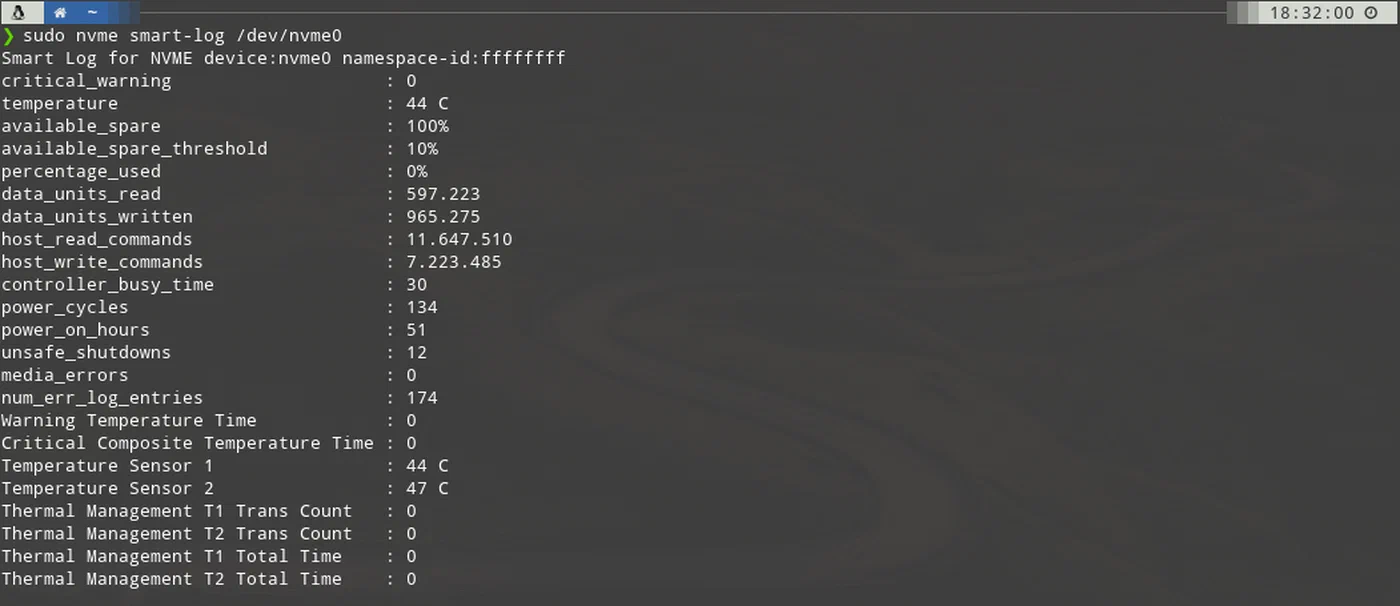
/dev/nvme0 -a -n standby -s L/../../1/02 -m root -M exec /usr/share/smartmontools/smartd-runnerThe key NVMe SMART attributes to watch:
percentage_used: drive wear percentage (alert at 90%+)available_spare: remaining replacement block percentage (alert below 10%)critical_warning: any non-zero value indicates a hardware condition requiring immediate attentiontemperature: operational temperature; alert above 75°C for sustained operation
Enable and start smartd:
sudo systemctl enable smartd
sudo systemctl start smartd
For ad-hoc NVMe health checks, nvme-cli provides detailed information beyond SMART:
# Full SMART log
sudo nvme smart-log /dev/nvme0

# Drive controller info including firmware version and PCIe link details
sudo nvme id-ctrl /dev/nvme0

# Check for any logged errors
sudo nvme error-log /dev/nvme0
Interpreting Benchmark Trends Over Time
Once you have a few months of benchmark data in your CSV log, you can visualize trends. A 5-10% performance decrease over two years is normal and expected as the drive’s write amplification factor increases with wear. A 20%+ drop in random IOPS warrants investigation — check SMART data for increased media errors, elevated temperature during operation, or a drop in available spare capacity. A sudden large drop (40%+) in sequential speeds often indicates the drive has entered a degraded operating mode and should be replaced proactively.
The combination of periodic fio benchmarks and continuous smartd monitoring gives you both the performance baseline and the health signal needed to manage NVMe drives confidently over their lifetime.