How to Profile and Optimize Python Memory Usage

You can find and fix memory leaks in Python using three tools that complement each other well: memray
for high-level profiling with flame graphs, tracemalloc
from the standard library for line-level allocation tracking, and objgraph
for visualizing object reference graphs. The typical workflow starts with memray to identify which functions consume the most memory, moves to tracemalloc to pinpoint exact lines of code, and finishes with objgraph to understand why objects are not being garbage collected. Combined with optimization techniques like generators, __slots__, memory-mapped files, and chunked processing, this approach can reduce peak memory by 50-80% in data-heavy applications.
How CPython Manages Memory
Before reaching for profiling tools, it helps to understand what is actually happening under the hood. CPython uses a private heap managed by pymalloc, a small-object allocator optimized for objects under 512 bytes. Larger objects fall through to the system’s malloc() (glibc on Linux). The pymalloc system allocates 256KB arenas subdivided into 4KB pools, and this arena-based architecture has direct consequences for memory behavior that often surprises developers.
Reference counting is the primary memory management mechanism. Every object carries an ob_refcnt field. When that count drops to zero, the object is freed immediately. This is deterministic and fast, but it cannot handle reference cycles - situations where object A references B and B references A, but nothing else references either.
That is where the cyclic garbage collector comes in. The gc module runs periodically to detect and collect reference cycles. It operates on three generations with configurable thresholds. You can check the defaults with gc.get_threshold(), which returns (700, 10, 10). Generation 0 collects most frequently, and objects that survive collections get promoted to higher generations.
The common sources of memory bloat in Python applications tend to fall into a few patterns. Lists, dicts, and sets that grow without any cap will eat memory as data accumulates. Reference cycles involving __del__ methods prevented garbage collection entirely in CPython versions before 3.4. Using @lru_cache without setting maxsize (or @cache, which has no limit at all) creates unbounded caches that never shrink. Inner functions can capture references to large objects from their enclosing scope through closures. And C extensions make allocations that Python’s garbage collector cannot track at all.
There is also a fragmentation problem that catches people off guard. Even after freeing objects, pymalloc arenas are only returned to the OS when every single object in the arena has been freed. One surviving object in a 256KB arena keeps the entire arena allocated. This explains why you often see RSS (Resident Set Size) stay flat or barely decrease after deleting large objects.
Also, sys.getsizeof() is misleading for anything beyond simple curiosity. It returns the shallow size of an object - just the container, not its contents. Calling sys.getsizeof([1, 2, 3]) returns 88 bytes, which is the list object itself, not counting the integer objects it references. For recursive deep size measurement, use pympler.asizeof.asizeof() from the Pympler
library instead.
Profiling with memray: Finding the Big Allocators
memray
is the most capable Python memory profiler currently available. Developed by Bloomberg, it captures every allocation with native stack traces and produces rich visualizations. It uses LD_PRELOAD to intercept malloc/free calls, which means it captures allocations from both Python code and C extensions - something tracemalloc cannot do.
Install it with pip:
pip install memrayIt requires Python 3.8+ and runs on Linux and macOS. Windows support is experimental as of 2026.
The basic workflow is to run your script under memray, then generate reports from the recorded data:
# Record all allocations to a binary file
memray run -o output.bin my_script.py
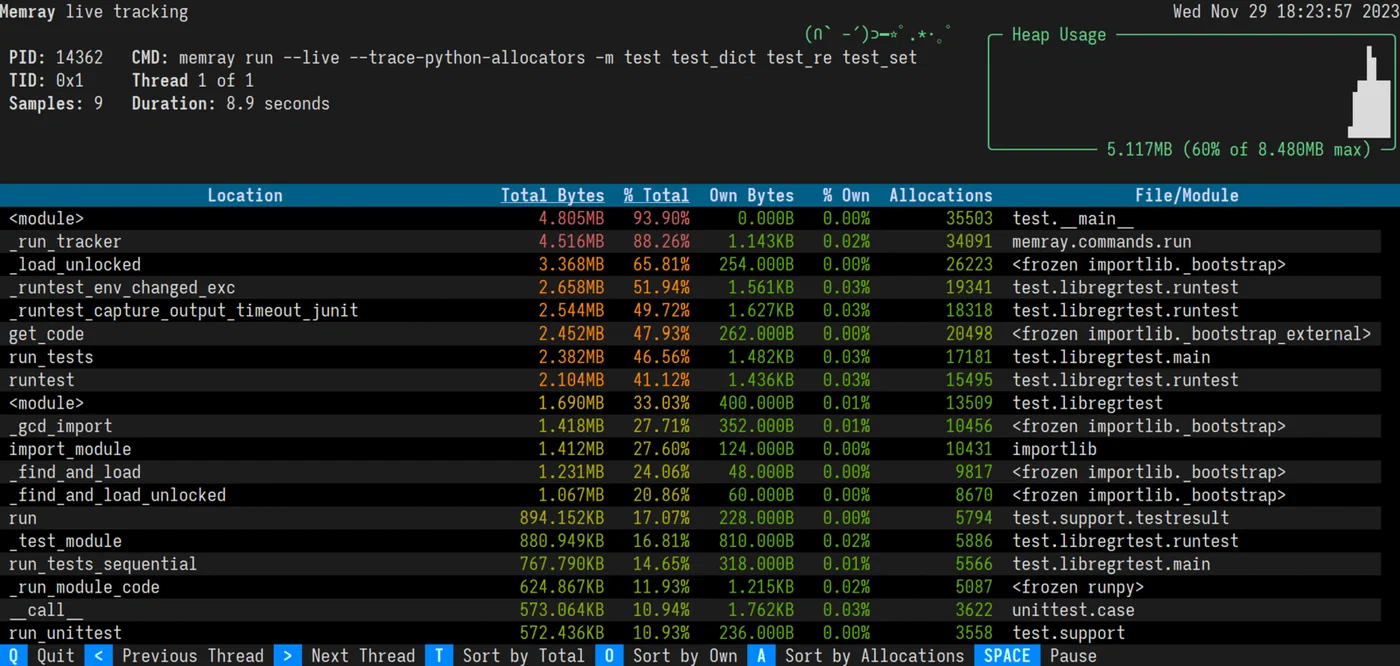
# For long-running servers, use live mode for real-time TUI display
memray run --live my_server.py
# Or attach to an already-running process
memray attach <pid>Once you have a recording, generate a flame graph:
memray flamegraph output.bin -o flamegraph.html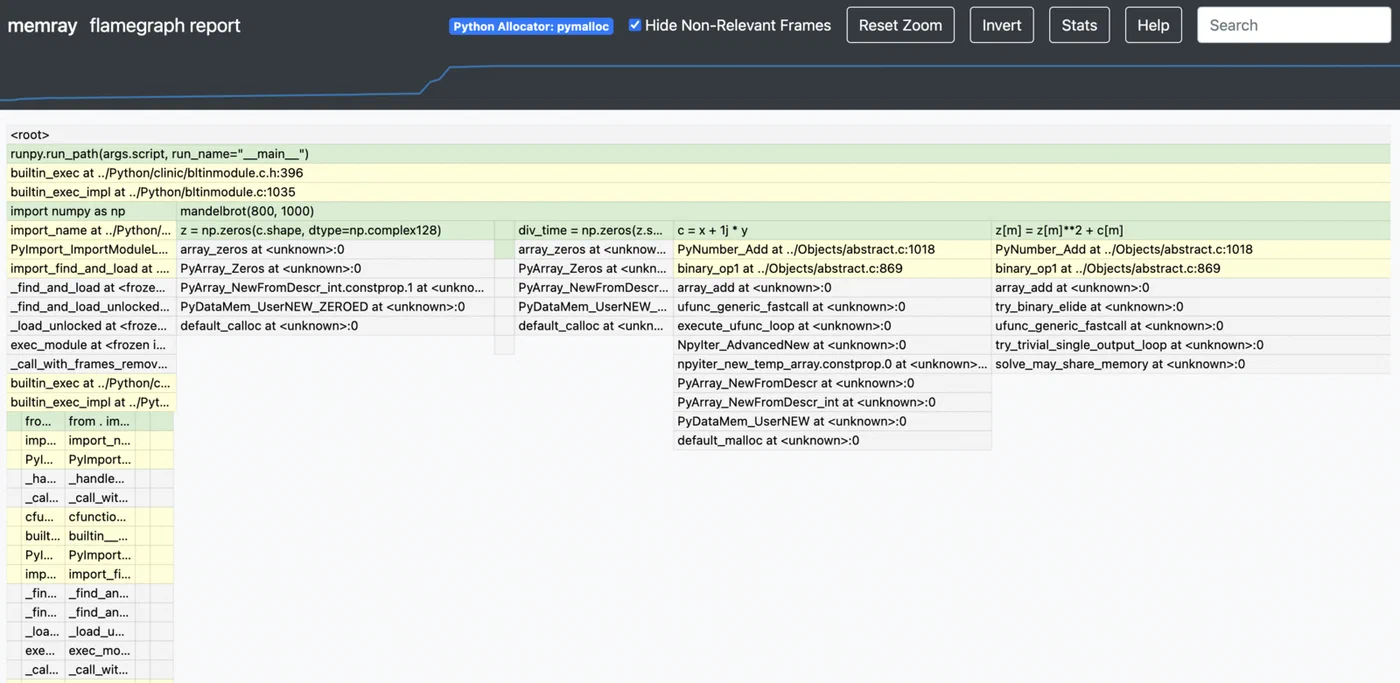
This produces an interactive HTML flame graph where the width of each frame represents the total memory allocated by that call stack. The widest frames at the top are your biggest memory consumers. You can click into frames to zoom, which makes it practical even for applications with deep call stacks.
For a more structured view, the table report is useful:
memray table output.bin --biggest-allocs 20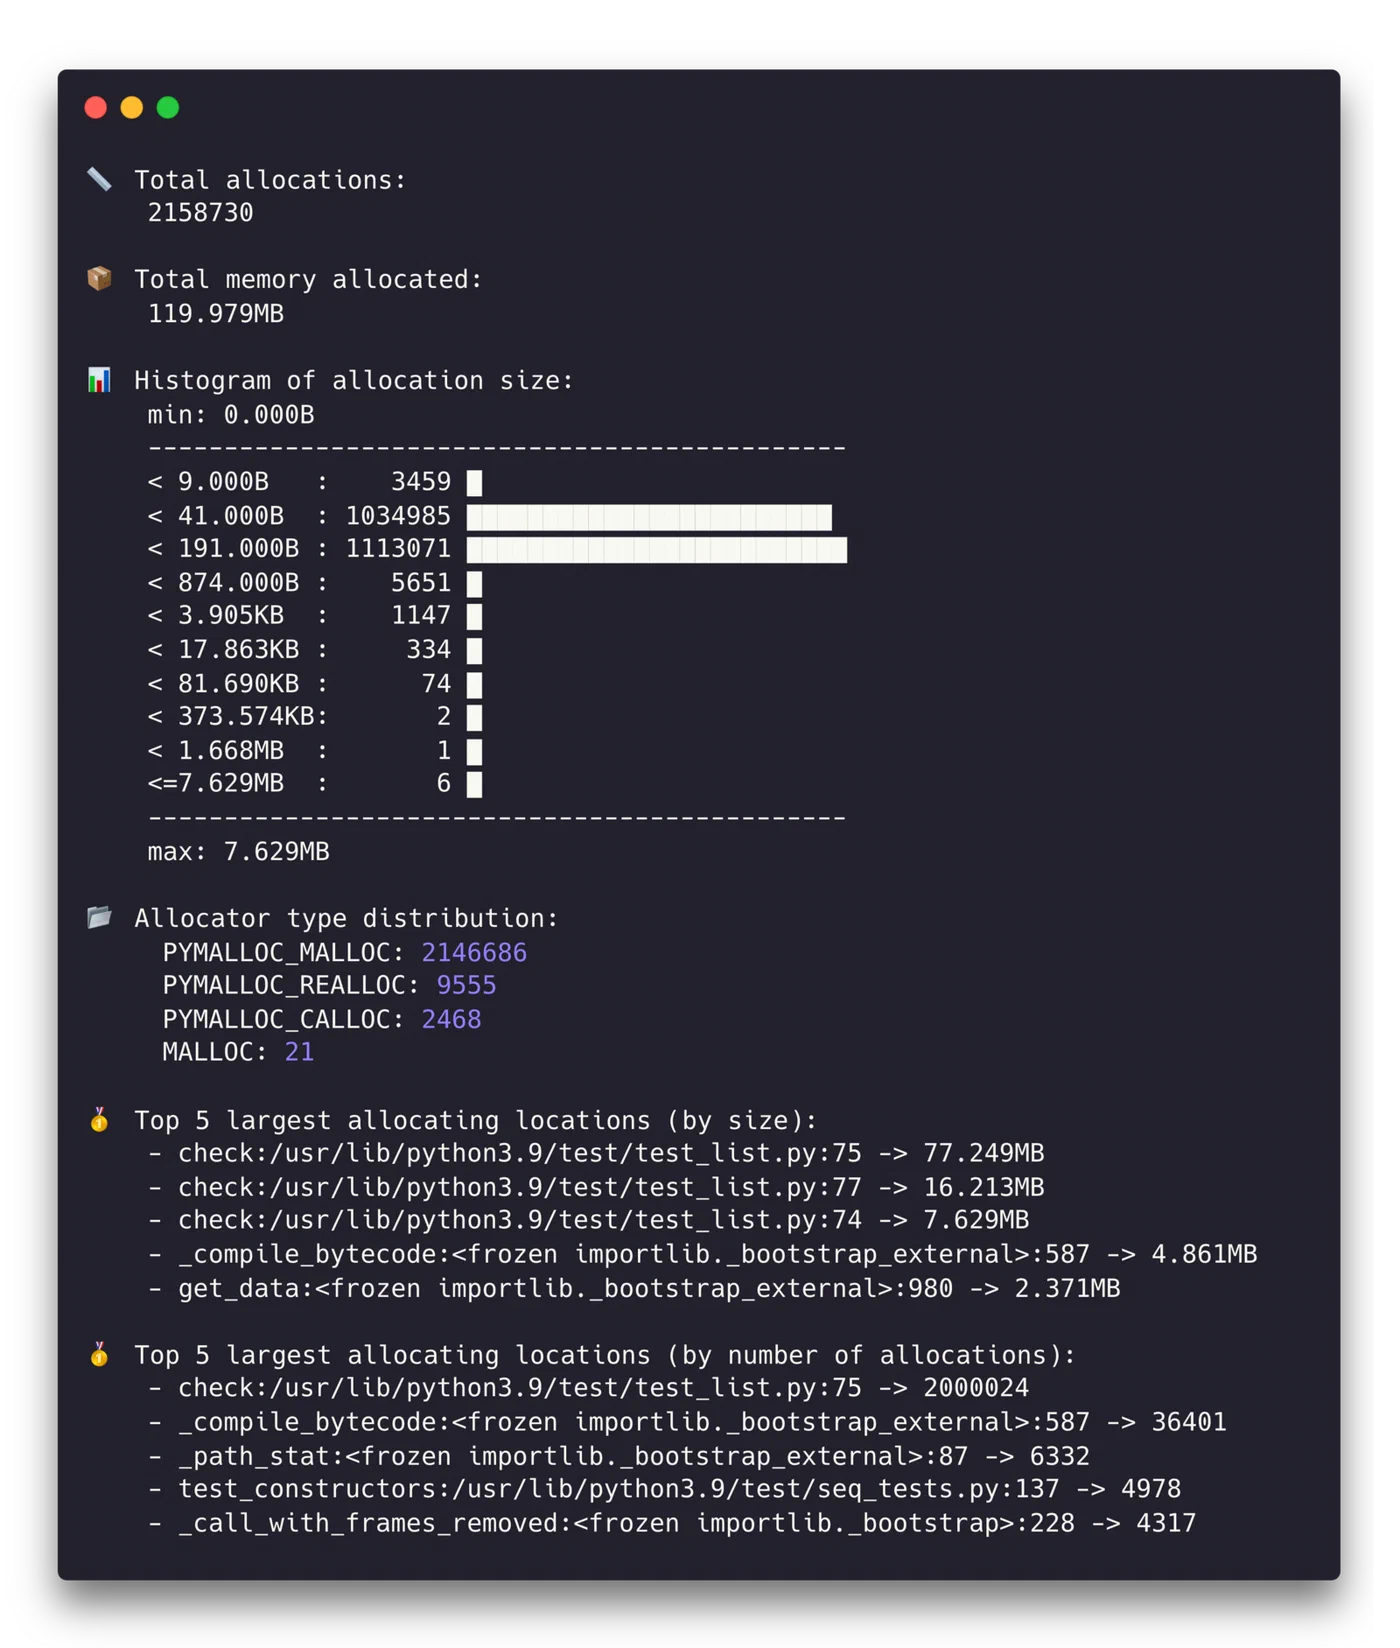
This shows a sorted table of allocations by size, with source file, line number, and allocation count. Focusing on the top 20 allocation sites usually covers 80-90% of your memory budget.
The temporal analysis mode is particularly valuable for distinguishing between different memory patterns:
memray temporal output.binThis shows memory usage over time. Linear growth usually indicates a leak. Step-wise growth suggests batch processing patterns. Sharp spikes that come back down are transient large allocations that may or may not be a problem depending on your memory constraints.
One of memray’s biggest advantages over other profilers is performance. It adds less than 5% overhead compared to 20-30% for tracemalloc in allocation-heavy code. This makes it practical for profiling scenarios that are closer to real production behavior.
Line-Level Tracking with tracemalloc and objgraph
Once memray has identified the hot spots - say, process_data() allocates 500MB - you need more surgical tools to find the exact lines responsible and understand why objects stick around.
tracemalloc for Pinpointing Allocations
tracemalloc is built into the standard library, which makes it the lowest-friction option for detailed investigation. Enable it at startup:
python -X tracemalloc=10 my_script.pyThe number specifies how many stack frames to capture. Ten is enough for most cases. You can also enable it programmatically with tracemalloc.start(10) early in your code.
The most powerful technique is snapshot comparison for leak detection:
import tracemalloc

tracemalloc.start(10)

# Take a baseline snapshot
snapshot1 = tracemalloc.take_snapshot()

# Run the suspected leaking operation
process_batch()

# Take another snapshot and compare
snapshot2 = tracemalloc.take_snapshot()
top_stats = snapshot2.compare_to(snapshot1, 'lineno')

for stat in top_stats[:10]:
    print(stat)
The output looks something like:
my_script.py:42: size=15.2 MiB (+15.2 MiB), count=150000 (+150000), average=106 B
my_script.py:67: size=8.4 MiB (+8.4 MiB), count=50000 (+50000), average=176 B
This tells you that line 42 allocated 15.2MB of new memory consisting of 150,000 objects averaging 106 bytes each. That level of precision usually makes the problem obvious.
objgraph for Reference Investigation
When you know what is leaking but not why it survives garbage collection, objgraph fills in the picture. Install it along with Graphviz for visualization:
pip install objgraph graphvizTo see which object types are growing between two points in your code:
import objgraph

# At point A
objgraph.show_growth(limit=10)

# ... run some operations ...

# At point B
objgraph.show_growth(limit=10)
If dict count grows by 10,000 between requests, something is accumulating dictionaries. To find out what is holding references to a specific object:
objgraph.show_backrefs(
    objgraph.by_type('MyClass')[0],
    max_depth=5,
    filename='refs.png'
)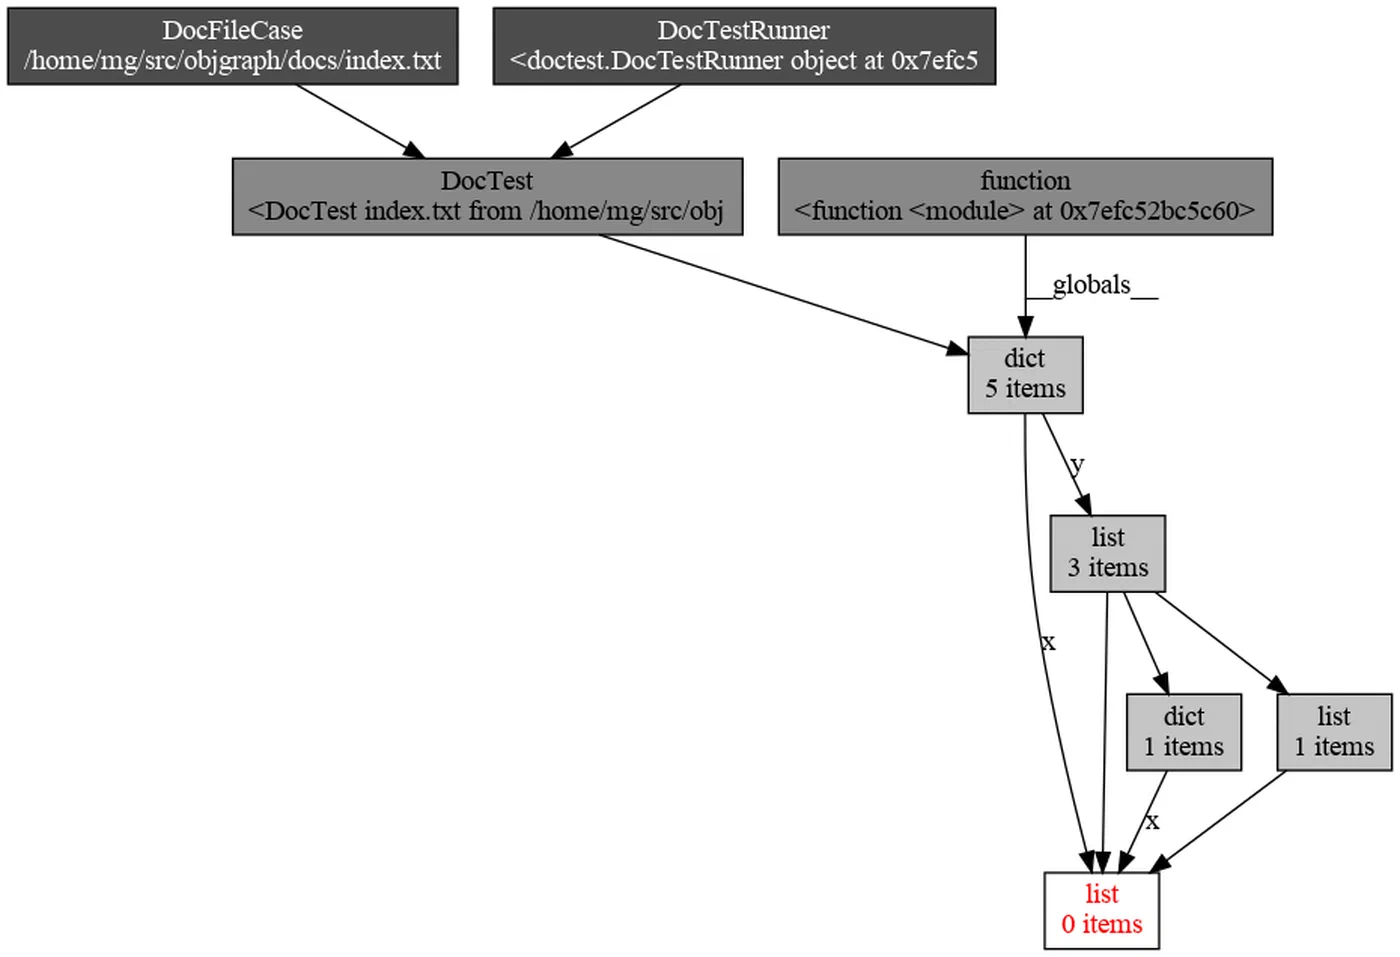
This generates a PNG showing all objects that hold a reference to your leaking MyClass instance. The culprit is usually a reference stored in a global variable, a module-level cache, or a callback closure that was registered but never cleaned up.
Putting the Three Tools Together
In practice, you use these tools in sequence. Start with a memray flame graph to identify that process_data() allocates 500MB. Then take tracemalloc snapshots inside process_data() to find the exact line building a list of 2 million dictionaries. Finally, use objgraph to discover that those dictionaries survive because they are referenced from a module-level cache that was never bounded.
Optimization Techniques: Reducing Peak Memory
Once you know where the memory goes, here are concrete techniques to bring it down, ordered from simplest to most impactful.
Generators Instead of Lists
Replace list comprehensions with generator expressions when you do not need all items in memory at once:
# This materializes everything in memory
data = [transform(x) for x in huge_list]

# This processes items one at a time
data = (transform(x) for x in huge_list)
For file processing, for line in open('big.csv') is already a generator. Combine generators with itertools.islice() for batching.
slots on Data Classes
Adding __slots__ to a class eliminates the per-instance __dict__, which carries about 112 bytes of overhead on 64-bit CPython:
class SensorReading:
    __slots__ = ('name', 'value', 'timestamp')

    def __init__(self, name, value, timestamp):
        self.name = name
        self.value = value
        self.timestamp = timestamp
For a million instances, this saves roughly 107MB. In Python 3.10+, @dataclass(slots=True) does this automatically.
Pandas and NumPy Memory Reduction
Downcast columns to smaller types when the data allows it:
df = df.astype({'age': 'int8', 'price': 'float32'})Going from int64 to int8 saves 7 bytes per value. Load only the columns you need:
df = pd.read_csv('file.csv', usecols=['col1', 'col2'])For low-cardinality string columns (status codes, country names), pd.Categorical typically gives a 10x memory reduction.
Chunked Processing
Instead of loading an entire dataset into memory, process it in chunks:
# Instead of this
df = pd.read_csv('10gb.csv')

# Do this
for chunk in pd.read_csv('10gb.csv', chunksize=50000):
    process(chunk)
Peak memory stays constant regardless of file size. The same pattern applies to database queries with cursor.fetchmany(1000).
Memory-Mapped Files
For large binary files, search indexes, or shared memory between processes, memory-mapped files let you access file contents without loading them entirely:
import mmap

with open('large_file.bin', 'rb') as f:
    mm = mmap.mmap(f.fileno(), 0, access=mmap.ACCESS_READ)
    # Access mm like a byte string - the OS pages in only what you touch
Cache Management and Explicit Cleanup
Bound your caches. Use @functools.lru_cache(maxsize=1000) instead of unbounded @cache. For caches where you do not want to prevent garbage collection, use weakref.WeakValueDictionary.
After working with large objects, del large_object followed by gc.collect() forces immediate collection. For resource management, implement context managers with __enter__/__exit__ to guarantee cleanup.
String Interning
For applications processing millions of repeated strings - log parsing, data pipelines - sys.intern(string) deduplicates identical strings to a single object. CPython already interns small strings and identifiers, but explicit interning catches longer repeated strings that would otherwise each consume their own allocation.
Profiling in Production: Continuous Memory Monitoring
Memory issues frequently appear only under real production load, and you need to monitor without introducing enough overhead to change the behavior you are trying to observe.
Export RSS and VMS as Prometheus metrics using psutil :
import psutil

process = psutil.Process()
mem_info = process.memory_info()
# Export mem_info.rss and mem_info.vms every 10 seconds
Set alerts when RSS exceeds 80% of your container memory limit.
For tracemalloc in production, enable it with minimal overhead using a single frame depth:
PYTHONTRACEMALLOC=1Then expose a /debug/memory HTTP endpoint (behind authentication) that takes a snapshot and returns the top 20 allocators as JSON. The CPU impact at one frame depth is roughly 5%.
For container deployments, set explicit memory limits (--memory=2g in Docker or resources.limits.memory: 2Gi in Kubernetes). Python does not automatically respect these limits, so set PYTHONMALLOC=malloc and MALLOC_ARENA_MAX=2 to reduce glibc’s arena overhead. For long-running services, jemalloc
often provides better memory reuse than glibc’s default allocator:
LD_PRELOAD=/usr/lib/libjemalloc.so.2 python my_server.pyFor leak detection in long-running services, take tracemalloc snapshots every hour and compare adjacent pairs. Steady growth in allocations from the same source file is a strong leak signal. Automate this with a background task that writes comparison results to structured logs.
Finally, for latency-sensitive services, you can disable automatic garbage collection with gc.disable() and run gc.collect() during idle periods between request batches. This prevents GC pauses during request handling. But this requires careful monitoring - without periodic collection, uncollected reference cycles will cause unbounded memory growth.
The overall approach is straightforward: measure first with memray, drill down with tracemalloc, understand retention with objgraph, then apply the optimization technique that matches your specific bottleneck. Most Python memory problems come down to either holding too many objects at once or accidentally keeping references to objects you no longer need. Both are fixable once you can see where the memory is actually going.