Track Your Home's Energy Usage with Home Assistant

The average American household spends around $1,500 per year on electricity - and most of that money disappears without any clear understanding of where it goes. Your utility company’s smart meter might tell you how many kilowatt-hours you consumed yesterday, but it will not tell you that your aging gaming console is quietly draining 30W while it sits “off,” or that your electric water heater runs at the exact same time each morning when grid prices are at their daily peak. Home Assistant changes that equation entirely. By pairing the right monitoring hardware with the built-in Energy Dashboard, you can achieve per-device, per-circuit visibility that genuinely transforms how you consume electricity.
Why Monitor Home Energy Usage?
The behavioral change argument alone is compelling: studies consistently show that households that can see their energy consumption in real time reduce it by 10 to 15 percent, with no other changes required. Visibility creates accountability. When you can watch your electricity meter tick upward in real time on a dashboard, leaving lights on or running a half-empty dishwasher feels tangibly wasteful in a way that a monthly bill statement never captures.
Standard advanced metering infrastructure (AMI) smart meters - the digital meters your utility has almost certainly already installed - are a start, but they are limited. They report daily or hourly kWh totals to the utility, and many utilities expose this data through a third-party portal with a 24-hour lag. That is not actionable intelligence. Home Assistant’s Energy Dashboard gives you granularity down to the individual circuit or appliance, updating every few seconds.
One of the biggest wins from real-time monitoring is identifying “vampire loads.” These are devices drawing 5 to 50 watts continuously in standby mode: televisions, game consoles, desktop computers, streaming boxes, phone chargers left plugged in, and network equipment. Individually they seem trivial, but collectively they can account for 10 percent or more of a household’s annual electricity bill. Once you can see them, you can eliminate them with smart plugs and automations.
The final and increasingly important motivation is dynamic pricing. Time-of-Use (TOU) tariffs are becoming the default in many regions, meaning electricity costs two or three times more during evening peak hours than at 2 AM. If you can shift your dishwasher, washing machine, and EV charger to run off-peak automatically - triggered by real-time price signals rather than a fixed schedule - the savings compound quickly.
Monitoring Hardware Options
The right hardware depends on what you want to measure and your comfort level with electrical panels. Here is a breakdown of the main categories.
Whole-home CT clamp monitors are the recommended entry point for most households. They use current transformer (CT) clamps that snap around the main feed cables inside your breaker panel without requiring any interruption of power. The clamp induces a tiny current proportional to the current flowing through the wire, giving you real-time watt measurements.
Circuit-level monitors go further, placing individual CT sensors on each circuit breaker, giving you a breakdown by circuit rather than just the whole home total.
Smart plugs handle individual appliances that you want to track in isolation - a chest freezer, a server rack, or an EV charger connected to a standard outlet.
| Device | Price (approx.) | Accuracy | Circuits | HA Integration | Local API |
|---|---|---|---|---|---|
| Shelly EM3 | ~$45 | ±1% | 3 (whole-home or 3 circuits) | Native (local) | Yes |
| Emporia Vue Gen 3 | ~$80 | ±2% | 16 circuits | Native (local, 2026) | Yes |
| IotaWatt | ~$120 | ±0.5% | Up to 14 circuits | Native (local) | Yes |
| Sense Home Energy Monitor | ~$299 | ±1% | Whole-home + ML appliance ID | Via cloud integration | No |
| TP-Link Kasa Smart Plug | ~$15 | ±2% | Per-plug | Native (local) | Yes |
| IKEA TRETAKT (Zigbee) | ~$10 | ±2% | Per-plug | Via Zigbee2MQTT or ZHA | Yes |
| Shelly Plug S | ~$18 | ±1% | Per-plug | Native (local) | Yes |
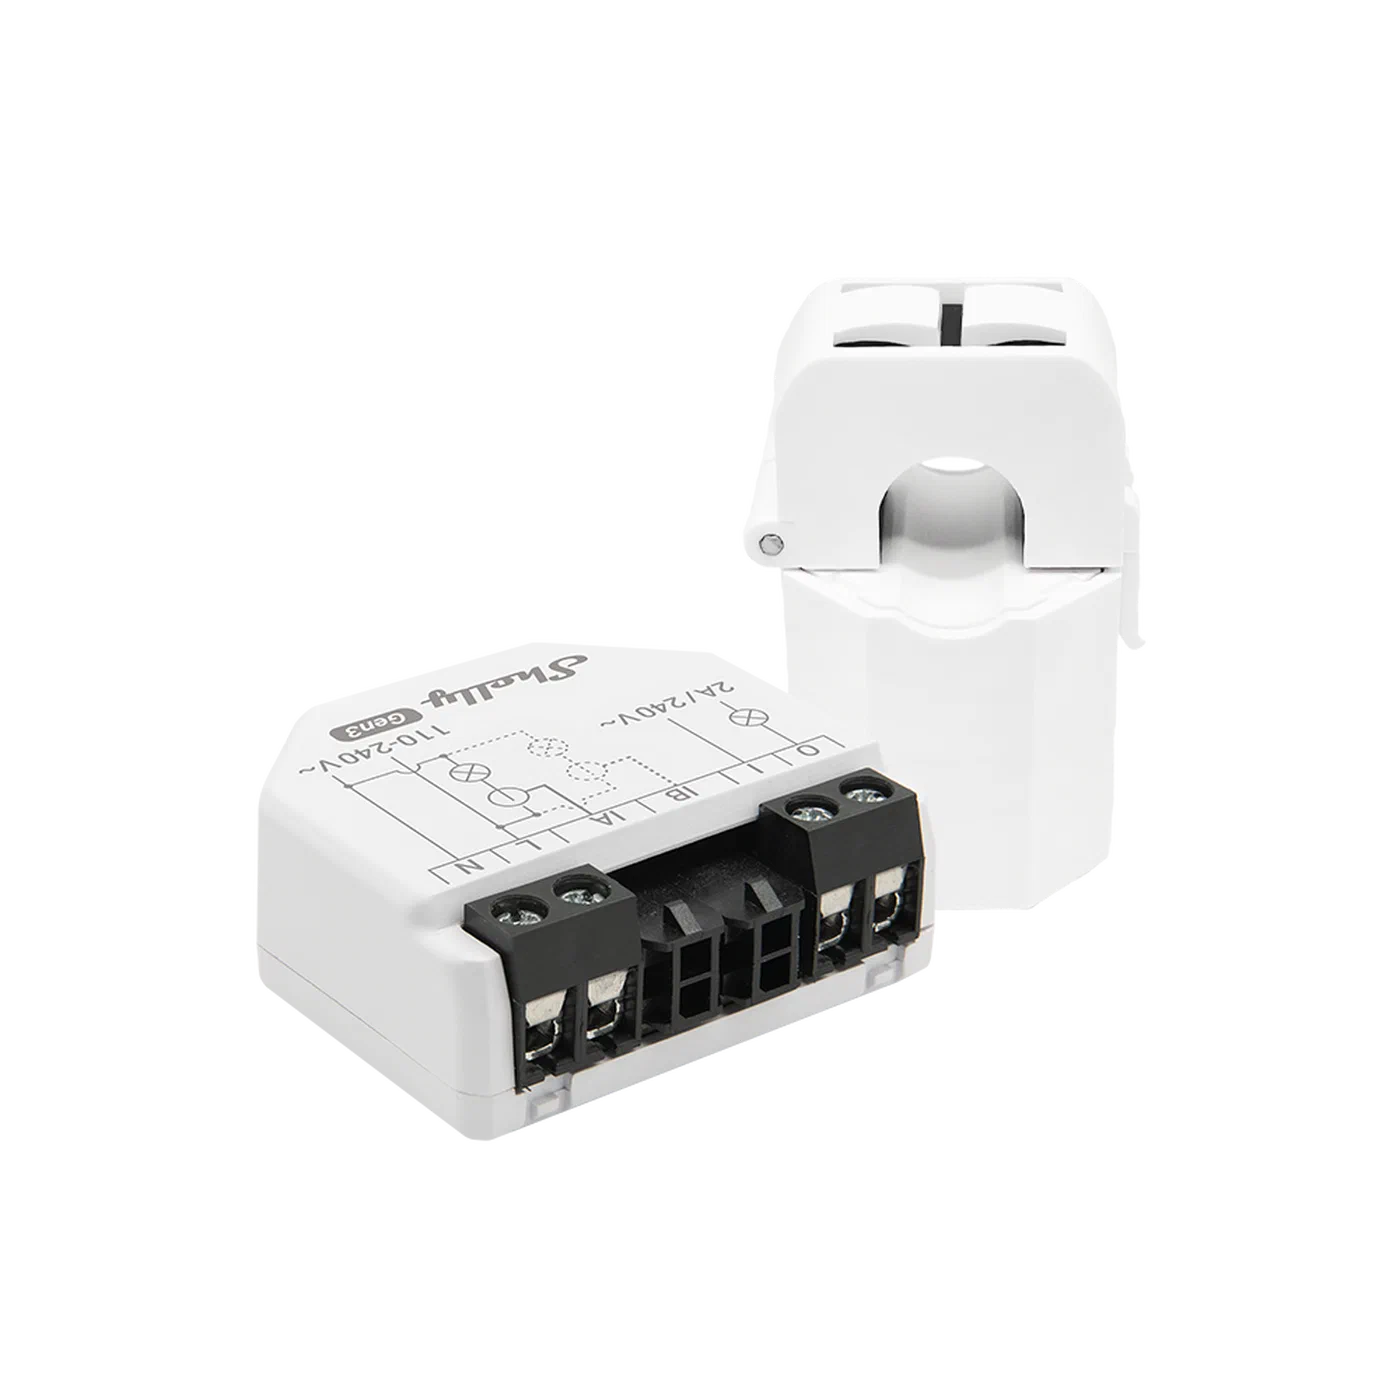
The Shelly EM3 is the pragmatic starting point for most people. At around $45, it supports three-phase installations, runs entirely on your local Wi-Fi with no cloud dependency, and has a mature native integration in Home Assistant that exposes power, voltage, current, and cumulative energy sensors out of the box.
The Emporia Vue Gen 3 is the right choice if you want circuit-level granularity without paying IotaWatt prices. Its 16-sensor kit covers a typical panel completely, and as of 2026 it supports a fully local API, eliminating the cloud dependency of earlier generations.
The IotaWatt is the gold standard for precision. Its ±0.5% accuracy, open-source firmware, and robust local web API make it the choice for anyone who wants to trust their data enough to build billing-accurate reports. It is meaningfully more expensive, but for solar owners tracking feed-in credits down to the cent, that accuracy matters.
The Sense monitor takes a different approach: it uses machine learning applied to the high-frequency waveform of your main feed to identify individual appliances by their electrical “fingerprint.” The results are impressive when they work, but appliance detection is probabilistic, the device is cloud-dependent, and at $299 it is a significant investment.
A Safety Note on CT Clamp Installation
Working inside an electrical breaker panel is genuinely hazardous. The main lugs - the thick cables entering at the top of the panel from the utility - carry line voltage and are not protected by any breaker. They are live whenever utility power is present, even with your main breaker switched off.
If you are not comfortable working around live electrical conductors, hire a licensed electrician. The CT clamps themselves are low-voltage and safe to handle, but positioning them requires reaching past or near the live main lugs. In many jurisdictions, opening the main panel also requires a permit. Check local regulations before proceeding.
If you do proceed yourself: work slowly, use insulated tools, do not touch the main lugs or bus bars, and consider wearing electrician’s rubber gloves rated for the panel voltage. Snap the CT clamps around the conductors before connecting them to the monitoring device, and ensure the monitoring device itself is mounted outside the panel or in a safe enclosure.
Setting Up the Home Assistant Energy Dashboard
Once your monitoring hardware is installed and its sensors are appearing in Home Assistant, configuring the Energy Dashboard takes about ten minutes. Navigate to Settings → Energy to open the configuration wizard.
The wizard breaks energy sources into four categories: Grid Consumption, Grid Return (solar feed-in), Solar Production, and Battery Storage. For a basic setup you only need Grid Consumption.
The most important concept: the Energy Dashboard requires sensors that report cumulative energy in kilowatt-hours (kWh), not instantaneous power in watts. Your Shelly EM3 exposes both - use the energy entity (labeled in kWh) rather than the power entity (labeled in W). If your device only exposes a watt sensor, you need to create a helper to convert it.
The integration helper (or its YAML equivalent, riemann_sum_integral) handles this conversion:
# configuration.yaml
sensor:
  - platform: integration
    source: sensor.my_device_power
    name: "My Device Energy"
    unit_prefix: k
    round: 2
    method: left
This creates a new sensor (sensor.my_device_energy) that accumulates kilowatt-hours over time by integrating the watt readings. Add this sensor to the Energy Dashboard and Home Assistant handles the rest.
For solar production, select the cumulative kWh sensor from your inverter integration - Fronius, SolarEdge, or Enphase integrations all expose this directly. If you export electricity back to the grid, also configure the Grid Return field with your feed-in kWh sensor. This enables net metering tracking: Home Assistant will show you exactly how much solar you produced, how much you self-consumed, and how much you exported for credit.
Battery storage requires two sensors: one for energy charged into the battery and one for energy discharged from it. These are separate because charging is not 100% efficient; the dashboard tracks the round-trip efficiency implicitly through the difference.
Individual device tracking supports up to ten appliances. Add your smart plug sensors here - the washing machine, the chest freezer, the gaming PC - and they appear as named items in the device breakdown view alongside their daily, weekly, and monthly kWh totals and costs.
Identifying Energy Hogs with Statistics
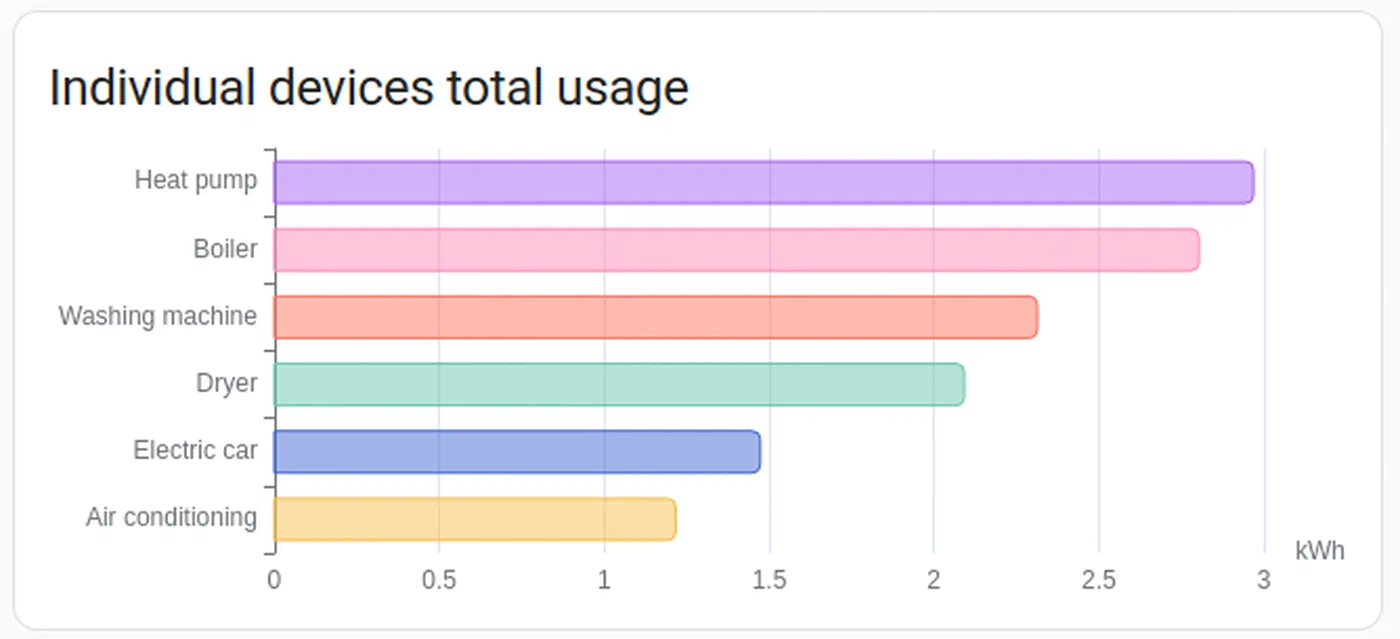
With the dashboard populated, the real analysis begins. The device breakdown panel is the most immediately useful view: it ranks your tracked devices by energy consumption over whatever time window you select. If your server is consuming more kWh per month than your refrigerator, that becomes obvious at a glance.
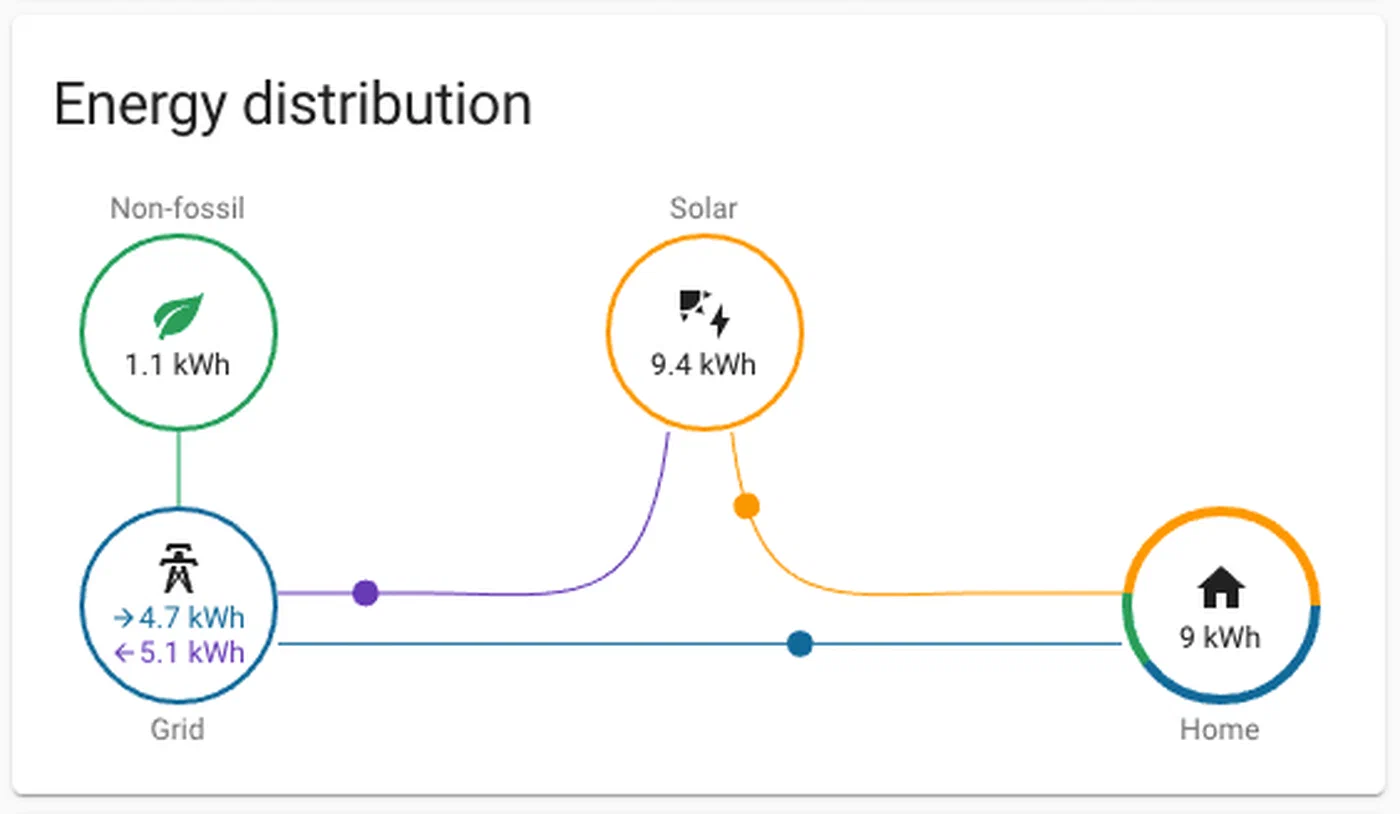
The “Power Flow” card (available as a Lovelace dashboard card) visualizes real-time energy flow as an animated diagram: solar panels feed into the home and battery, the grid makes up any shortfall, and individual high-draw devices appear as labeled branches. It is the single most effective tool for communicating the state of your home’s energy system to other household members.
For deeper analysis, the Statistics developer tool (accessible at Developer Tools → Statistics) allows you to export sensor history to CSV. Drop that into a spreadsheet and you can calculate things like “what percentage of my consumption happens between 4 PM and 9 PM” - exactly the kind of insight that motivates shifting behavior.
Standby power is worth targeting specifically. A useful template sensor subtracts the wattage of devices you know are intentionally running from the whole-home total:
# configuration.yaml
template:
  - sensor:
      - name: "Baseline Standby Power"
        unit_of_measurement: "W"
        state: >
          {% set total = states('sensor.grid_power') | float(0) %}
          {% set known = states('sensor.server_power') | float(0)
                       + states('sensor.ev_charger_power') | float(0)
                       + states('sensor.washing_machine_power') | float(0) %}
          {{ [total - known, 0] | max | round(1) }}
When this sensor reads 80W at 3 AM with the house empty, you have found your vampire load budget. Start switching smart plugs off one by one and watch it fall.
The history_stats integration is also valuable for understanding usage patterns:
sensor:
  - platform: history_stats
    name: "Washing Machine Daily Runtime"
    entity_id: binary_sensor.washing_machine_running
    state: "on"
    type: time
    start: "{{ now().replace(hour=0, minute=0, second=0) }}"
    end: "{{ now() }}"
Automating Based on Energy Data
Visibility is valuable; automation is transformative. Home Assistant’s energy sensors become triggers and conditions for automations that actively optimize your consumption.
EV Charger Scheduler: Rather than charging on a fixed overnight schedule, trigger charging when the grid price drops below a threshold using the Octopus Energy integration (UK) or Tibber (US/EU):
automation:
  - alias: "EV Charging - Start on Cheap Rate"
    trigger:
      - platform: numeric_state
        entity_id: sensor.octopus_energy_electricity_current_rate
        below: 0.10
    condition:
      - condition: numeric_state
        entity_id: sensor.ev_battery_level
        below: 85
    action:
      - service: switch.turn_on
        target:
          entity_id: switch.ev_charger
Standby Cutter: When total home consumption drops below 150W (everyone asleep or away), shut off known vampire loads:
automation:
  - alias: "Standby Power Cutter"
    trigger:
      - platform: numeric_state
        entity_id: sensor.grid_power
        below: 150
        for:
          minutes: 10
    action:
      - service: switch.turn_off
        target:
          entity_id:
            - switch.living_room_tv_plug
            - switch.gaming_console_plug
            - switch.office_monitor_plug
Solar Surplus Router: When solar production exceeds consumption by 500W for ten minutes - energy that would otherwise be exported for minimal credit - redirect it to a water heater or pool pump:
automation:
  - alias: "Solar Surplus - Heat Water"
    trigger:
      - platform: template
        value_template: >
          {{ (states('sensor.solar_power') | float(0) -
              states('sensor.home_consumption_power') | float(0)) > 500 }}
        for:
          minutes: 10
    action:
      - service: switch.turn_on
        target:
          entity_id: switch.water_heater_boost
The utility_meter integration is essential for billing-cycle-aligned reporting:
utility_meter:
  daily_energy:
    source: sensor.grid_energy_total
    cycle: daily
  monthly_energy:
    source: sensor.grid_energy_total
    cycle: monthly
  monthly_energy_peak:
    source: sensor.grid_energy_total
    cycle: monthly
    tariffs:
      - peak
      - offpeak
This creates separate sensors that reset at the configured cycle boundaries - perfect for matching your utility bill’s billing period and for tracking TOU tariff periods separately.
Integrating Dynamic Energy Pricing
Static per-kWh rates are increasingly rare. Most utilities now offer (or mandate) Time-of-Use tariffs, and some offer genuinely dynamic pricing tied to wholesale market rates.
Octopus Energy (UK) offers the Agile tariff , where prices update every 30 minutes based on wholesale rates. The Octopus Energy Home Assistant integration exposes current and forecast prices as sensors, enabling genuinely intelligent scheduling. It also has native intelligent EV charging support that coordinates with the car’s API.
Amber Electric (Australia) offers similar wholesale price exposure. Their integration works on the same principle: a sensor reporting the current spot price in cents/kWh that you can use as an automation trigger or condition.
In the US, Tibber
provides real-time pricing in select markets. For utilities without a direct integration, you can scrape TOU schedule data into a rest sensor or use a schedule helper that mirrors your utility’s published peak/off-peak windows.
A clean pattern is a binary_sensor that consolidates “is it currently cheap?”:
template:
  - binary_sensor:
      - name: "Electricity Cheap Rate"
        state: >
          {{ states('sensor.current_electricity_rate') | float(0) < 0.12 }}
        device_class: power
Use this sensor as a condition in any automation that involves optional electricity consumption - the dishwasher, the washing machine, pre-heating or pre-cooling the house - and all of those automations automatically adapt as your tariff structure changes.
A particularly effective combination: use the weather forecast integration to predict tomorrow’s high temperature, and if the forecast is above 35°C (95°F) and the current electricity rate is cheap, pre-cool the house an hour before the peak window opens. The thermal mass of a well-insulated home will hold that coolness through several hours of expensive peak pricing, and your air conditioner runs when electricity is cheapest.
Putting It All Together
The path from a single-line monthly electricity bill to a fully instrumented, automatically optimized home energy system is incremental. Start with a Shelly EM3 on your main panel feed and spend a week watching the Energy Dashboard. You will identify your largest consumers within days. Then add smart plugs to the top two or three and build the standby-cutter automation. If you have solar, connect the inverter integration and configure net metering tracking. Finally, if your utility offers TOU or dynamic pricing, layer in the pricing integration and let the automations do the scheduling.
At each stage you are adding visibility, then control, then intelligence - and at each stage the returns are measurable. The 10 to 15 percent reduction that behavioral change alone produces is a floor, not a ceiling. Households with solar, batteries, EVs, and dynamic pricing integration consistently report 25 to 40 percent reductions in net electricity costs compared to an unmonitored, unautomated baseline. The hardware pays for itself quickly, and unlike most smart home projects, this one has a clear, calculable return on investment.