Python Memory Optimization: 50-80% Reduction with memray

You can find and fix Python memory leaks with three tools that pair well: memray
for flame graphs, tracemalloc
for line-level tracking, and objgraph
for object reference maps. Start with memray to spot the hungry functions. Drop into tracemalloc to find the exact lines. End with objgraph to see why objects won’t get collected. Pair this with generators, __slots__, memory-mapped files, and chunked reads to cut peak memory by 50-80% in data-heavy apps.
How CPython Manages Memory
Before grabbing a profiler, it helps to know what’s going on under the hood. CPython uses a private heap run by pymalloc, a small-object allocator tuned for objects under 512 bytes. Bigger objects fall through to the system’s malloc() (glibc on Linux). pymalloc carves out 256KB arenas split into 4KB pools. That arena layout shapes memory behavior in ways that often surprise developers.
Reference counting does the bulk of memory work. Every object carries an ob_refcnt field. When that count drops to zero, the object is freed right away. It’s fast and deterministic. However, it can’t handle reference cycles, where A points at B and B points back at A, with nothing else pointing at either one.
That’s where the cyclic garbage collector steps in. The gc module runs on a timer to find and free reference cycles. It works in three generations with tunable thresholds. Check the defaults with gc.get_threshold(). The call returns (700, 10, 10). Generation 0 runs most often, and objects that survive a sweep move up to the next generation.
Memory bloat in Python apps tends to fall into a few patterns. Lists, dicts, and sets with no cap will eat memory as data piles up. Reference cycles with __del__ methods blocked GC outright in CPython before 3.4. Using @lru_cache with no maxsize (or plain @cache, which has no cap) creates a cache that only grows. Inner functions can grab huge objects from the outer scope through closures. And C extensions allocate memory that Python’s GC can’t see at all.
There’s also a fragmentation problem that catches people off guard. Even after you free objects, pymalloc only hands an arena back to the OS once every object in that arena is freed. One survivor in a 256KB arena pins the whole thing. That’s why RSS (Resident Set Size) often stays flat or barely budges after you delete large objects.
One more trap: sys.getsizeof() is misleading past simple curiosity. It returns the shallow size of an object, just the container, not the contents. sys.getsizeof([1, 2, 3]) returns 88 bytes for the list shell. It does not count the integers inside. For a recursive deep size, use pympler.asizeof.asizeof() from the Pympler
library.
Profiling with memray: Finding the Big Allocators
memray
is the most capable Python memory profiler around today. Built by Bloomberg, it captures every allocation with native stack traces and ships rich visuals. It uses LD_PRELOAD to hook malloc and free calls. That means it sees allocations from both Python code and C extensions, which tracemalloc cannot.
Install it with pip:
pip install memrayIt needs Python 3.8+ and runs on Linux and macOS. Windows support is still experimental.
The basic flow is to run your script under memray, then build reports from the recording:
# Record all allocations to a binary file
memray run -o output.bin my_script.py

# For long-running servers, use live mode for real-time TUI display
memray run --live my_server.py

# Or attach to an already-running process
memray attach <pid>
Once you have a recording, generate a flame graph:
memray flamegraph output.bin -o flamegraph.html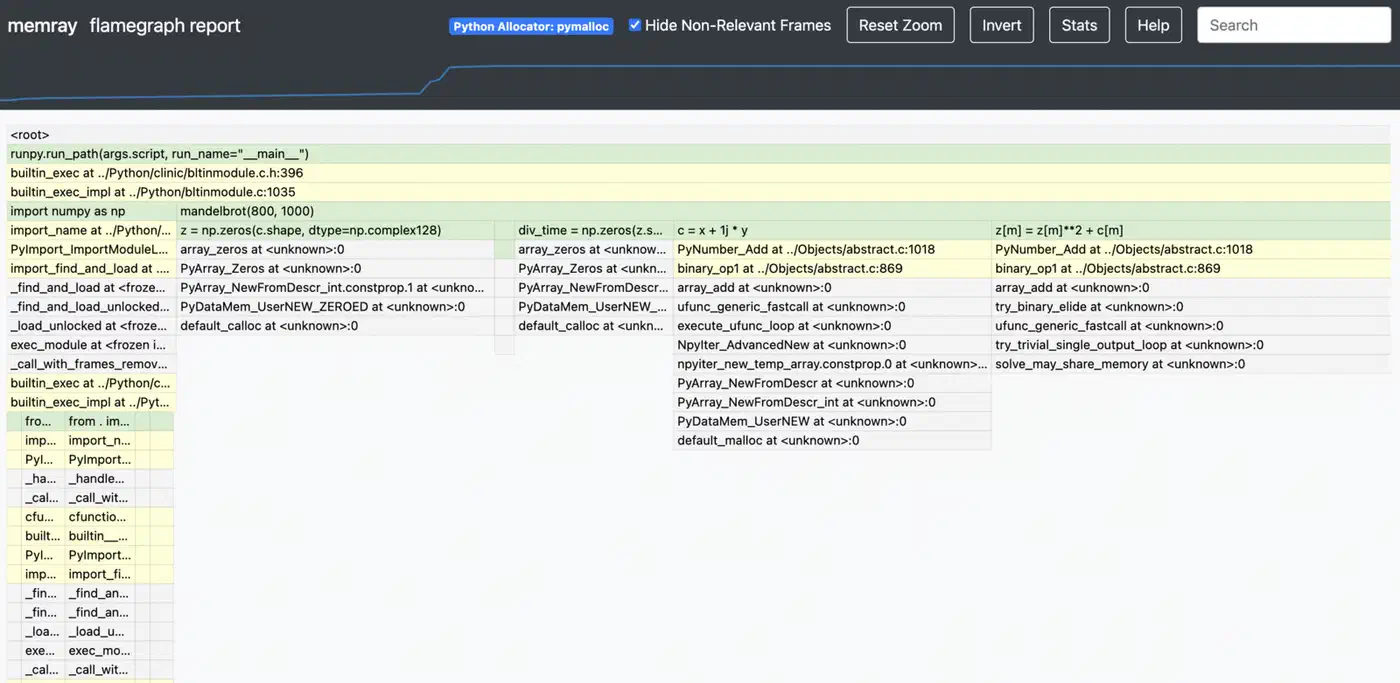
This builds an interactive HTML flame graph. The width of each frame shows the total memory that call stack allocated. The widest frames at the top are your top memory hogs. You can click a frame to zoom in, which keeps it usable even on apps with deep call stacks.
For a more structured view, the table report is useful:
memray table output.bin --biggest-allocs 20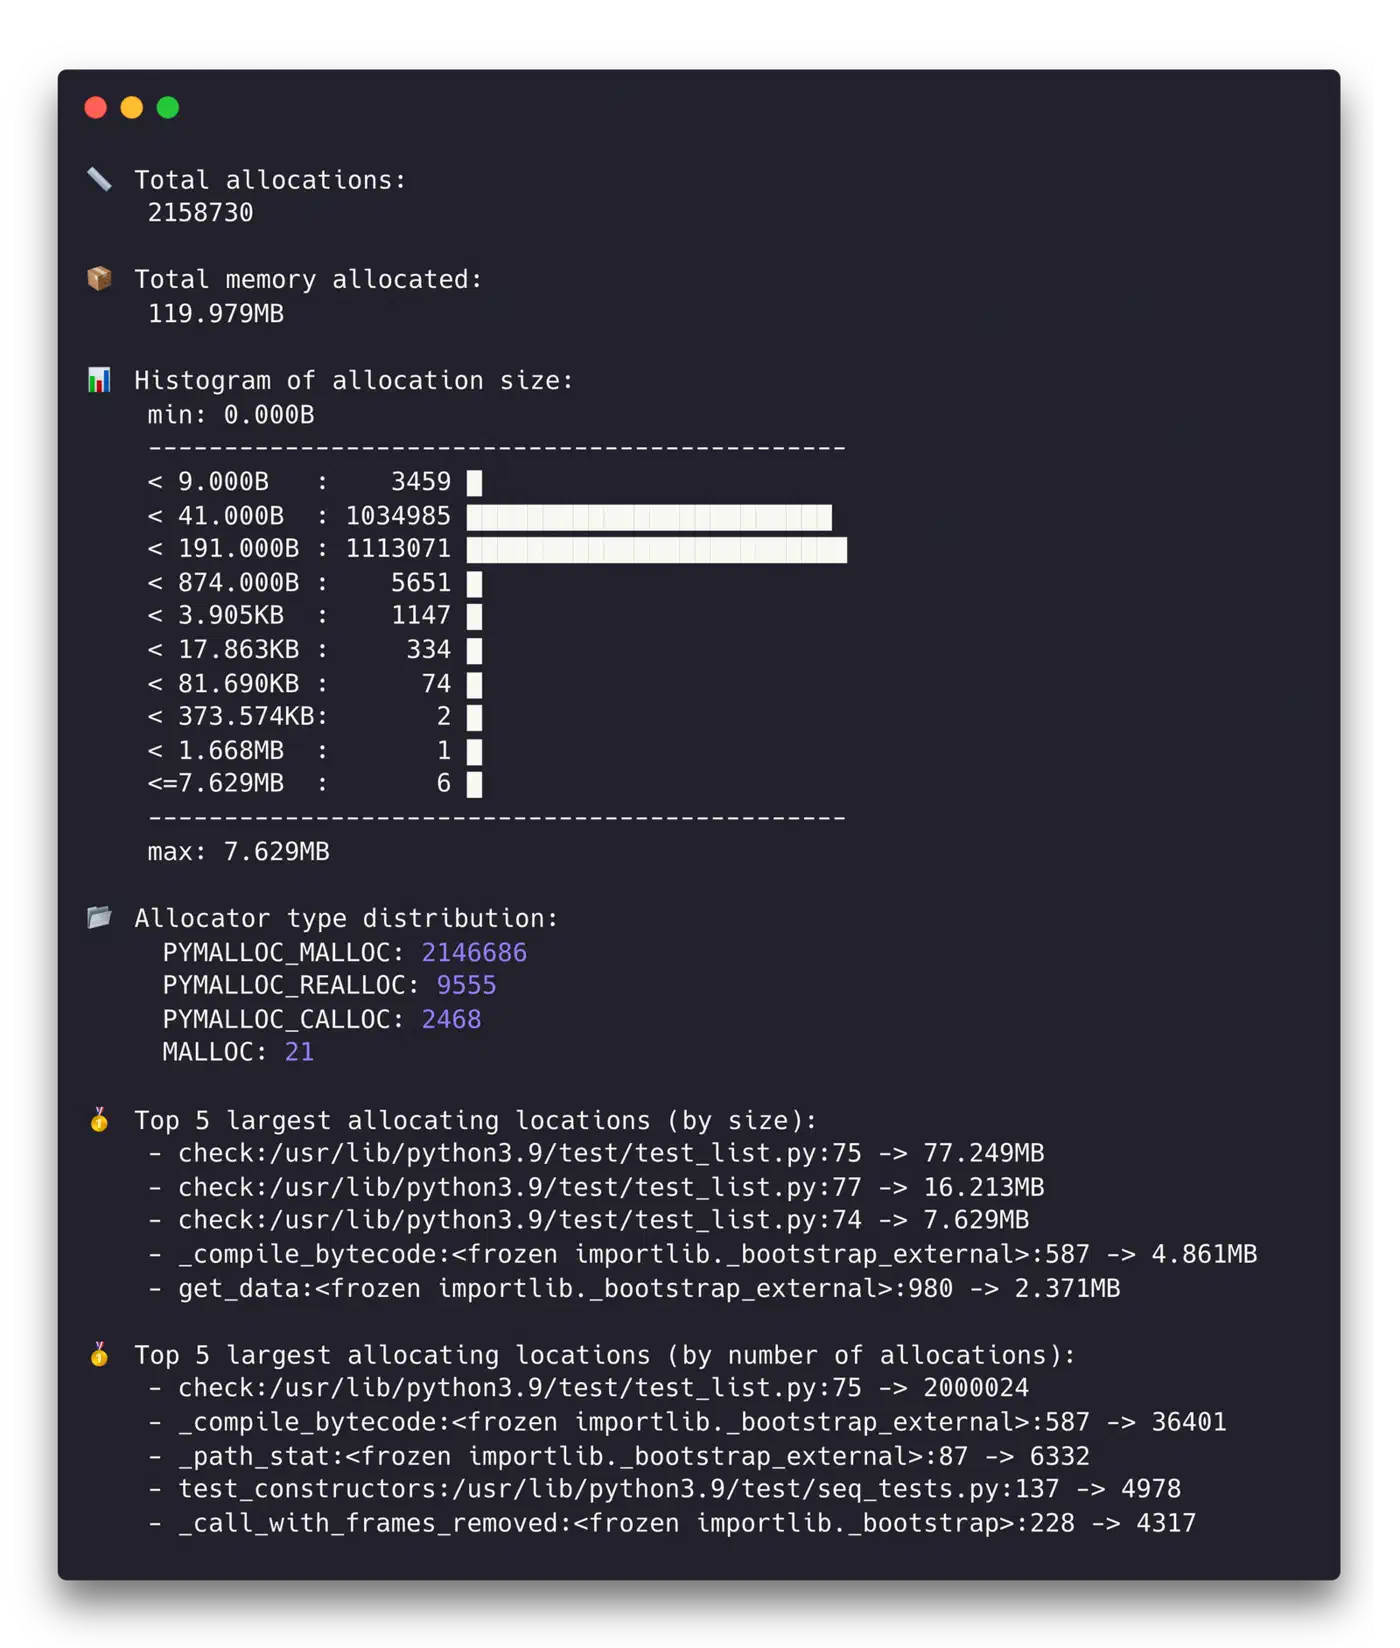
This prints a sorted table of allocations by size, with source file, line number, and count. The top 20 sites usually cover 80-90% of your memory budget.
The temporal mode is great for telling memory patterns apart:
memray temporal output.binThis plots memory use over time. Linear growth usually signals a leak. Step-wise growth points to batch work. Sharp spikes that drop back down are short-lived large allocations. Those may or may not be a problem, depending on your memory budget.
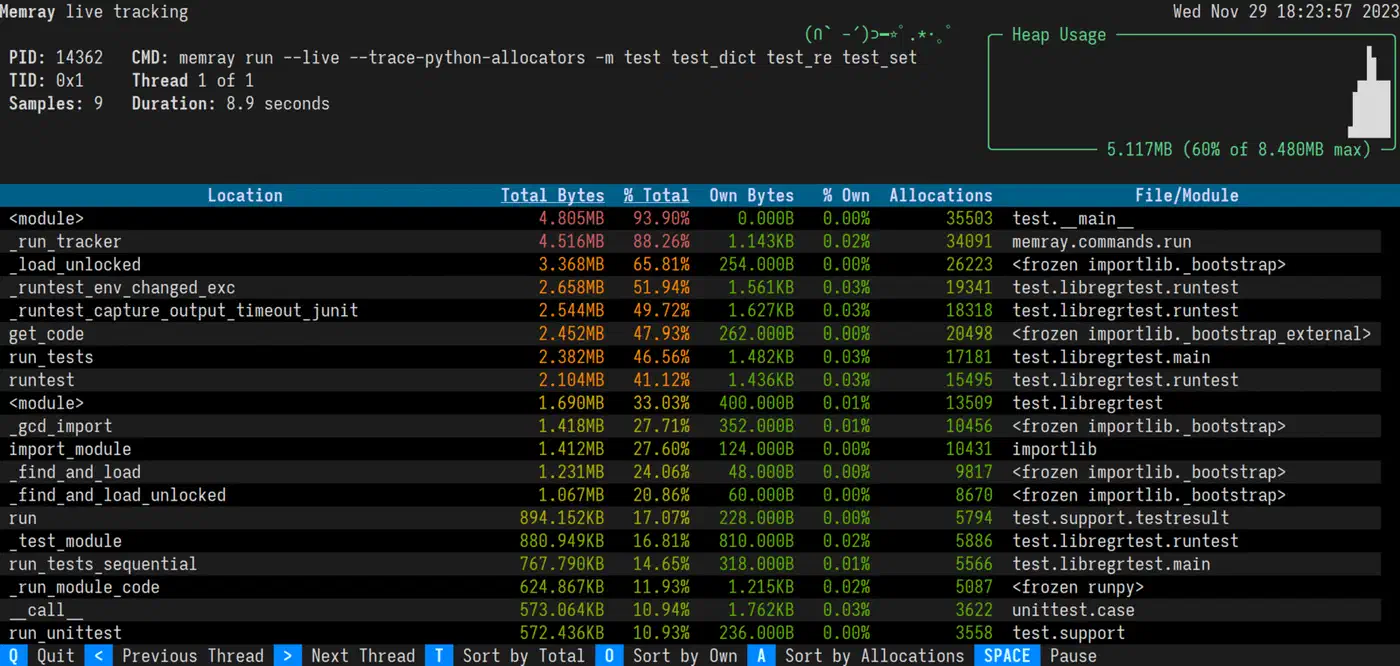
That live view is itself a Textual terminal app , so the same Python framework lets you build a monitoring dashboard like it for your own tools.
One of memray’s biggest wins over other profilers is speed. It adds less than 5% overhead, against 20-30% for tracemalloc in allocation-heavy code. That makes it usable for profiling runs that look close to real production.
Line-Level Tracking with tracemalloc and objgraph
Once memray flags the hot spots, say process_data() allocates 500MB, you need sharper tools. They find the exact lines and explain why objects stick around.
tracemalloc for Pinpointing Allocations
tracemalloc ships with the standard library, so it’s the easiest detailed option to reach for. Turn it on at startup:
python -X tracemalloc=10 my_script.pyThe number sets how many stack frames to capture. Ten is enough for most cases. You can also turn it on in code with tracemalloc.start(10) early on.
The strongest move is snapshot comparison for leak hunting:
import tracemalloc

tracemalloc.start(10)

# Take a baseline snapshot
snapshot1 = tracemalloc.take_snapshot()

# Run the suspected leaking operation
process_batch()

# Take another snapshot and compare
snapshot2 = tracemalloc.take_snapshot()
top_stats = snapshot2.compare_to(snapshot1, 'lineno')

for stat in top_stats[:10]:
    print(stat)
The output looks something like:
my_script.py:42: size=15.2 MiB (+15.2 MiB), count=150000 (+150000), average=106 B
my_script.py:67: size=8.4 MiB (+8.4 MiB), count=50000 (+50000), average=176 B
That tells you line 42 allocated 15.2MB of new memory, made up of 150,000 objects at 106 bytes each. That kind of precision usually makes the bug obvious.
objgraph for Reference Investigation
When you know what’s leaking but not why it survives GC, objgraph fills in the gap. Install it with Graphviz for the pictures:
pip install objgraph graphvizTo see which object types are growing between two points in your code:
import objgraph

# At point A
objgraph.show_growth(limit=10)

# ... run some operations ...

# At point B
objgraph.show_growth(limit=10)
If the dict count grows by 10,000 between requests, something is piling up dictionaries. To find out what holds a reference to a given object:
objgraph.show_backrefs(
    objgraph.by_type('MyClass')[0],
    max_depth=5,
    filename='refs.png'
)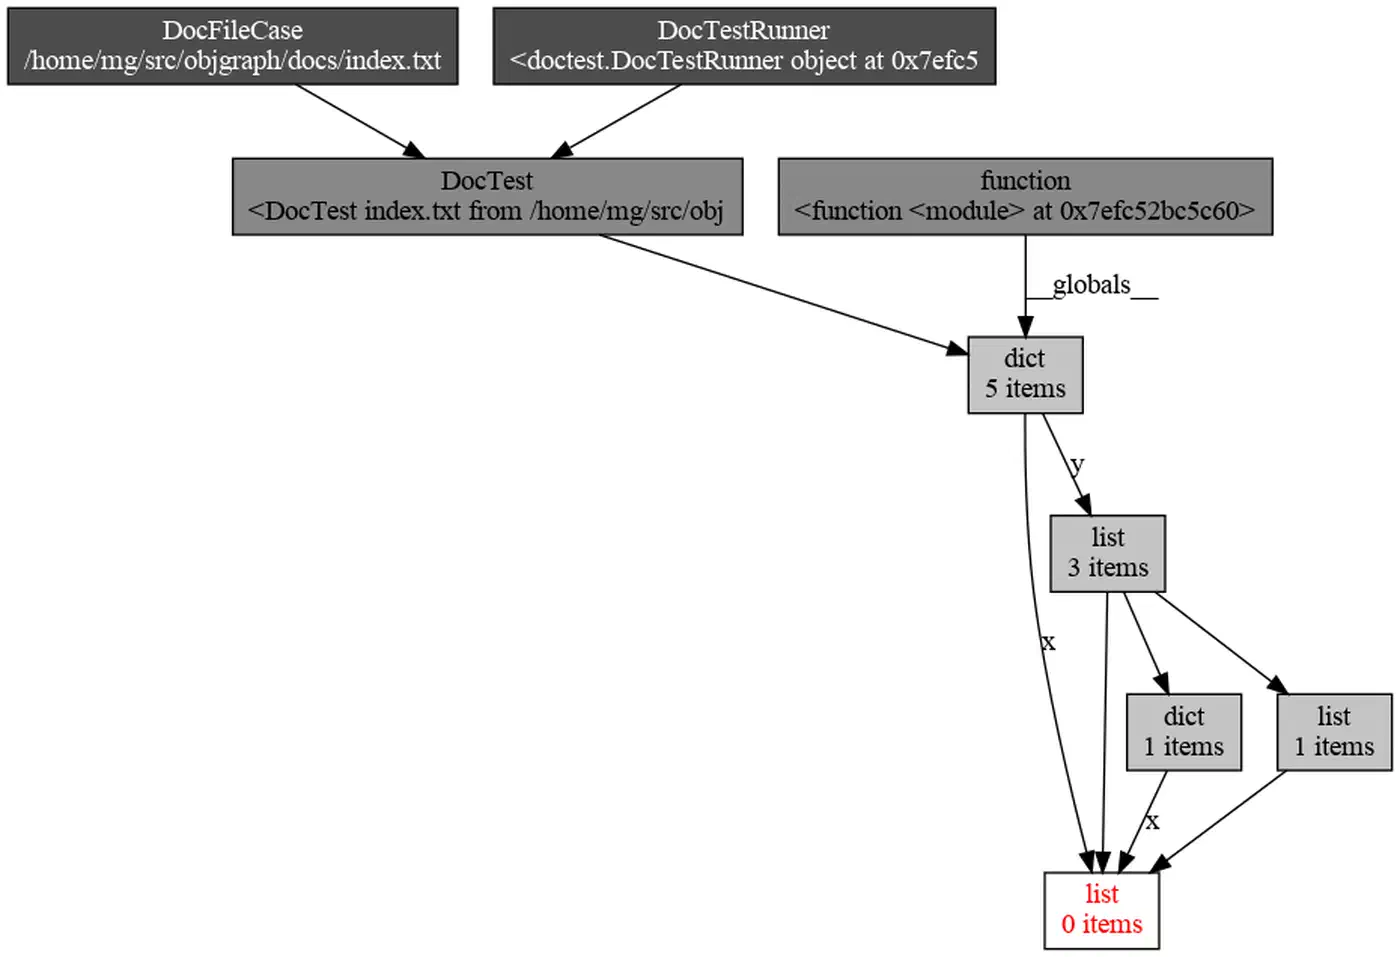
This builds a PNG of every object that holds a reference to your leaking MyClass instance. The culprit is usually a reference in a global, a module-level cache, or a callback closure that got registered but never cleaned up.
Putting the Three Tools Together
In practice, you use these tools in order. Start with a memray flame graph to see that process_data() allocates 500MB. Then take tracemalloc snapshots inside process_data() to find the line that builds a list of 2 million dicts. Last, run objgraph to learn that those dicts survive because a module-level cache holds them with no cap.
Optimization Techniques: Reducing Peak Memory
Once you know where the memory goes, here are solid moves to bring it down, sorted from easiest to biggest payoff.
Generators Instead of Lists
Swap list comprehensions for generator expressions when you don’t need every item in memory at once:
# This materializes everything in memory
data = [transform(x) for x in huge_list]

# This processes items one at a time
data = (transform(x) for x in huge_list)
For file work, for line in open('big.csv') is already a generator. Mix generators with itertools.islice() for batching.
slots on Data Classes
Adding __slots__ to a class drops the per-instance __dict__. That __dict__ carries about 112 bytes of overhead on 64-bit CPython:
class SensorReading:
    __slots__ = ('name', 'value', 'timestamp')

    def __init__(self, name, value, timestamp):
        self.name = name
        self.value = value
        self.timestamp = timestamp
For a million instances, that saves about 107MB. In Python 3.10+, @dataclass(slots=True) does this for you.
Pandas and NumPy Memory Reduction
Downcast columns to smaller types when the data allows it:
df = df.astype({'age': 'int8', 'price': 'float32'})Moving from int64 to int8 saves 7 bytes per value. Load only the columns you need:
df = pd.read_csv('file.csv', usecols=['col1', 'col2'])For string columns with few unique values (status codes, country names), pd.Categorical often cuts memory by 10x.
Chunked Processing
Rather than load a whole dataset into memory, work on it in chunks:
# Instead of this
df = pd.read_csv('10gb.csv')

# Do this
for chunk in pd.read_csv('10gb.csv', chunksize=50000):
    process(chunk)
Peak memory stays flat no matter how big the file is. The same pattern works for database queries
with cursor.fetchmany(1000). The process function itself is a pure data transform, so a property test that generates randomized chunks
can confirm it handles the odd inputs your handwritten tests skip.
Memory-Mapped Files
For large binary files, search indexes, or shared memory between processes, memory-mapped files let you read file content without loading the whole thing:
import mmap

with open('large_file.bin', 'rb') as f:
    mm = mmap.mmap(f.fileno(), 0, access=mmap.ACCESS_READ)
    # Access mm like a byte string - the OS pages in only what you touch
Cache Management and Explicit Cleanup
Cap your caches. Use @functools.lru_cache(maxsize=1000) instead of unbounded @cache. For caches that should not block GC, use weakref.WeakValueDictionary.
After you finish with a large object, del large_object plus gc.collect() forces collection right away. For resource handling, build context managers with __enter__/__exit__ to make cleanup sure.
String Interning
For apps that chew through millions of repeated strings, like log parsers and data pipelines, sys.intern(string) folds identical strings into a single object. CPython already interns short strings and identifiers. Explicit interning catches longer repeats that would each grab their own slot.
Profiling in Production: Continuous Memory Monitoring
Memory bugs often show up only under real production load. You need to watch them without adding so much overhead that you skew the very behavior you’re trying to see.
Export RSS and VMS as Prometheus metrics using psutil :
import psutil

process = psutil.Process()
mem_info = process.memory_info()
# Export mem_info.rss and mem_info.vms every 10 seconds
Set alerts when RSS goes over 80% of your container memory limit.
For tracemalloc in production, turn it on with low overhead by using a single frame depth:
PYTHONTRACEMALLOC=1Then expose a /debug/memory HTTP endpoint (behind auth) that takes a snapshot and returns the top 20 allocators as JSON. CPU cost at one frame depth is about 5%.
For container deploys, set hard memory caps (--memory=2g in Docker or resources.limits.memory: 2Gi in Kubernetes). Python won’t honor these on its own, so set PYTHONMALLOC=malloc and MALLOC_ARENA_MAX=2 to cut glibc’s arena overhead. For long-running services, jemalloc
often reuses memory better than glibc’s default allocator:
LD_PRELOAD=/usr/lib/libjemalloc.so.2 python my_server.pyFor leak hunting in long-running services, take tracemalloc snapshots every hour and compare each pair. Steady growth from the same source file is a strong leak signal. Automate this with a background task that writes the diffs to structured logs.
For latency-sensitive services, you can turn off the auto GC with gc.disable() and run gc.collect() during idle periods between request batches. That dodges GC pauses while you’re serving requests. However, it needs careful watching: with no periodic sweep, uncollected cycles will grow without bound.
The overall approach is simple. Measure first with memray. Drill down with tracemalloc. Pin retention with objgraph. Then apply the fix that fits your bottleneck. Most Python memory bugs come down to one of two things: holding too many objects at once, or keeping references to objects you no longer need. Both are fixable once you can see where the memory is going. When profiling shows those same functions are also CPU-bound, rewriting those hot paths in Rust can stack the wins. You get near-native speed alongside lower allocation pressure.