NVMe Gen5 Linux Benchmarking: 12K-14K MB/s Expected Performance

To benchmark your SSD on Linux, use fio for full sequential and random I/O tests, hdparm for a quick sequential read check, and GNOME Disks for a visual one-click run. A healthy Gen5 NVMe drive (a Crucial T705, Samsung 990 EVO Plus Gen5, or WD Black SN8100) should hit 12,000-14,000 MB/s sequential reads and over 1,200,000 random 4K read IOPS. Gen4 drives top out near 7,000 MB/s sequential and 800,000-1,000,000 IOPS. If your numbers fall well short, there is usually a clear reason: heat throttling, a PCIe slot at the wrong generation, or a bad I/O scheduler setting.
This guide covers the full stack, from a 30-second sanity check to a four-test fio suite. It explains what the numbers mean in real terms. It also sets up automated monitoring, so you catch drive decay before it turns into data loss.
Why and When to Benchmark Your SSD
Benchmarking is not just for checking marketing claims or winning forum arguments. There are several practical reasons to measure your drive’s speed. Knowing which case you are in tells you which tool to reach for.
Setting a baseline after install gives you a reference point to compare against later. SSDs slow down over their lifetime as NAND cells wear and the firmware adds more error correction. A drive doing 7,000 MB/s reads on day one should still be near that number two years later. If it has dropped to 5,500 MB/s, something worth a look has happened.
Before-and-after comparisons are the most common reason developers benchmark drives. Turning on LUKS full-disk encryption adds 10-20% overhead on writes. Switching from ext4 to Btrfs with compression changes the throughput profile. Changing the kernel I/O scheduler from none to mq-deadline or bfq shifts the latency spread. A benchmark before and after each change shows whether the tradeoff is fair.
Checking maker specs is useful because most drive reviews run on Windows with Samsung Magician or Crystal DiskMark. Linux speed can differ due to driver maturity, NVMe firmware quirks, or kernel scheduler defaults. Your drive may behave differently under Linux than the review you read before buying it. This is easy to verify on a drive shared with Windows . Boot each side and benchmark the same NVMe with its own native tools.
Spotting heat throttling grows more important with Gen5 drives. These drives draw 8-12W under load, throw off real heat, and will throttle hard without a good heatsink. A drive that hits 13,000 MB/s for 10 seconds and then drops to 4,000 MB/s is throttling. Running a benchmark with temperature monitoring alongside reveals this fast.
Before running any benchmark, check drive health with smartctl:
sudo apt install smartmontools  # if not already installed
sudo smartctl -a /dev/nvme0
Look at the Percentage Used field (alert if above 90%), Available Spare (alert below 10%), and Critical Warning (any non-zero value is bad). A benchmark on a failing drive gives misleading results and wastes time.
Quick Benchmarking with hdparm and GNOME Disks
Not every benchmark session needs a full fio suite. These two tools give you a useful speed snapshot in under 60 seconds. That is enough for quick health checks and casual before-and-after comparisons.
hdparm ships on almost every Linux system and needs no setup:
sudo hdparm -Tt /dev/nvme0n1The -T flag tests cached (RAM/CPU) read speed. That measures your memory, not your drive. The -t flag tests buffered disk reads. On a healthy Gen5 NVMe you will see something like:
/dev/nvme0n1:
 Timing cached reads:   56322 MB in  2.00 seconds = 28185.42 MB/sec
 Timing buffered disk reads: 9538 MB in  3.00 seconds = 3179.13 MB/sec
That 3,179 MB/s buffered read figure sits well below the drive’s real 13,000 MB/s ceiling, and that is expected. hdparm uses one thread with one I/O operation queued at a time. NVMe drives are built for heavy parallel work, with hundreds of queued operations across many CPU cores. By design, hdparm cannot saturate an NVMe controller. Treat it as a sanity check. If hdparm shows 200 MB/s on a Gen5 drive, something is badly wrong. If it shows 3,000-5,000 MB/s, the drive is probably healthy. Do not use it to compare Gen4 against Gen5.
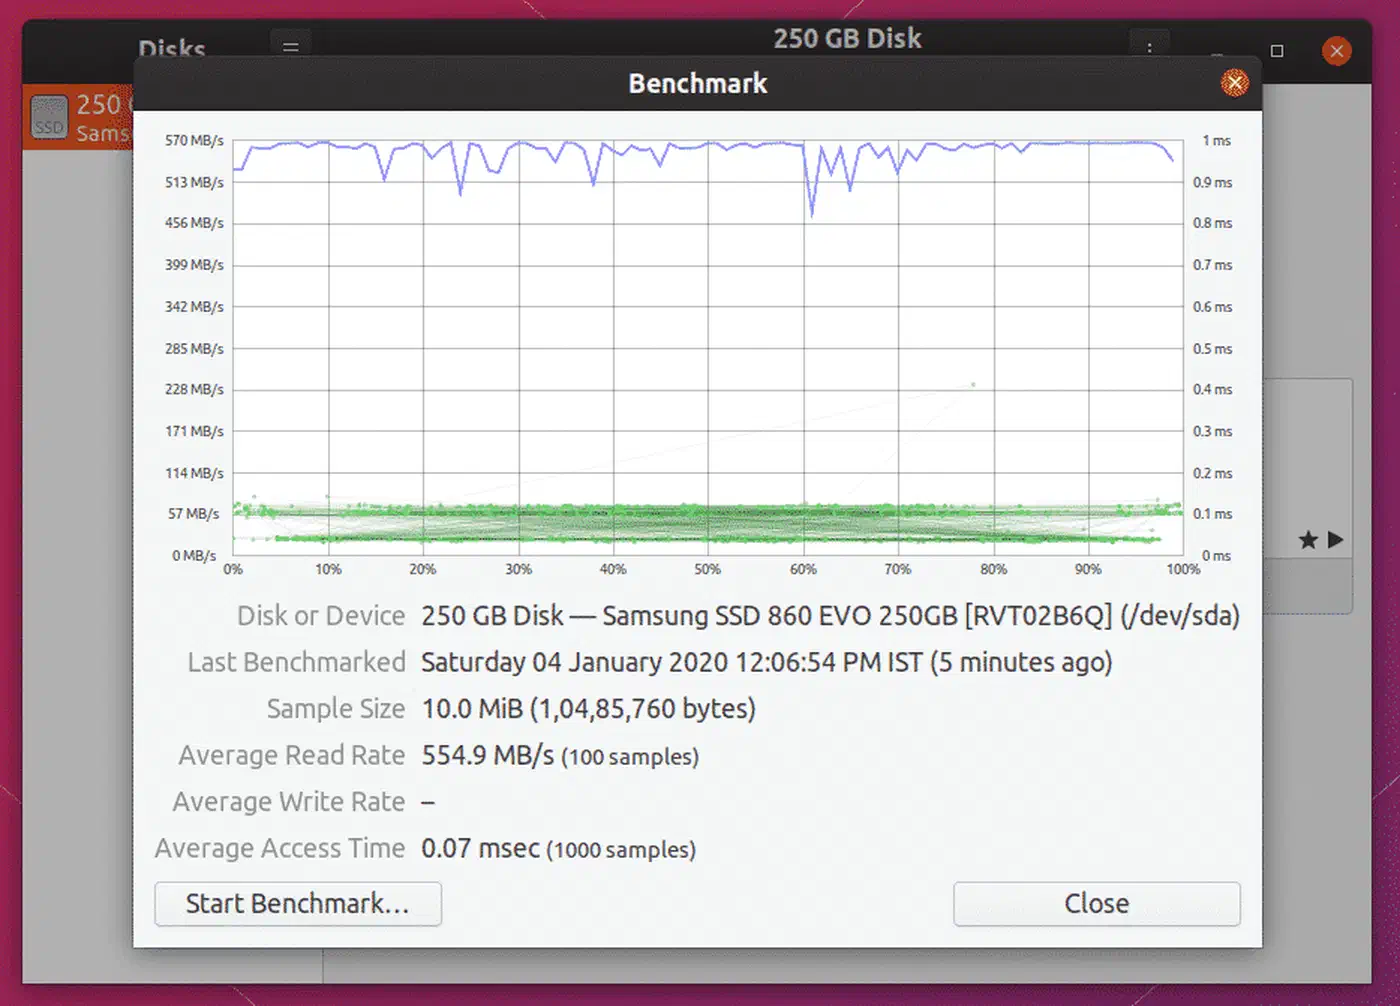
GNOME Disks gives you a proper multi-sample sequential benchmark with a visual throughput graph:
gnome-disks # or launch from your application menuSelect your NVMe drive from the left panel, click the gear icon, and choose “Benchmark Disk.” Configure the settings:
- Transfer rate sample size: 1 GiB is the minimum worth taking seriously
- Number of samples: 10 or more for a stable average
- Read-only or read-write: write tests require an unmounted partition or free space; for production drives, stick to read-only
GNOME Disks uses direct I/O (O_DIRECT) to skip the Linux page cache, so it measures real drive speed rather than cached reads. It runs fine outside of GNOME. KDE and other desktop users can install it from their package manager without pulling in the full GNOME stack.
One quick check before running any benchmark: verify which I/O scheduler is active for your NVMe device:
cat /sys/block/nvme0n1/queue/schedulerFor NVMe drives, none shows up as [none]. It means requests go straight to the hardware queue with no kernel scheduler layer in between. This is usually the right setting. If you see mq-deadline or another scheduler active (in brackets), switching to none may lift raw throughput:
echo none | sudo tee /sys/block/nvme0n1/queue/schedulerComprehensive Benchmarking with fio
fio (Flexible I/O Tester) is the industry standard for storage benchmarking on Linux. It supports every I/O pattern you need to test a drive. It outputs structured JSON for scripted analysis. It also generates the queue depth and parallel load needed to truly saturate NVMe hardware.
Install fio from your distribution’s package manager:
# Debian/Ubuntu
sudo apt install fio

# Fedora
sudo dnf install fio

# Arch Linux
sudo pacman -S fio
Version 3.36+ adds support for io_uring passthrough, the preferred I/O engine for NVMe testing. All commands below use --ioengine=io_uring.
Important safety note: the write tests below will overwrite data. Point fio at an empty partition, at a dedicated test file on an empty filesystem, or use the --filename=/path/to/testfile option to create a test file without touching existing data. Never run write tests against partitions that hold data you want to keep.
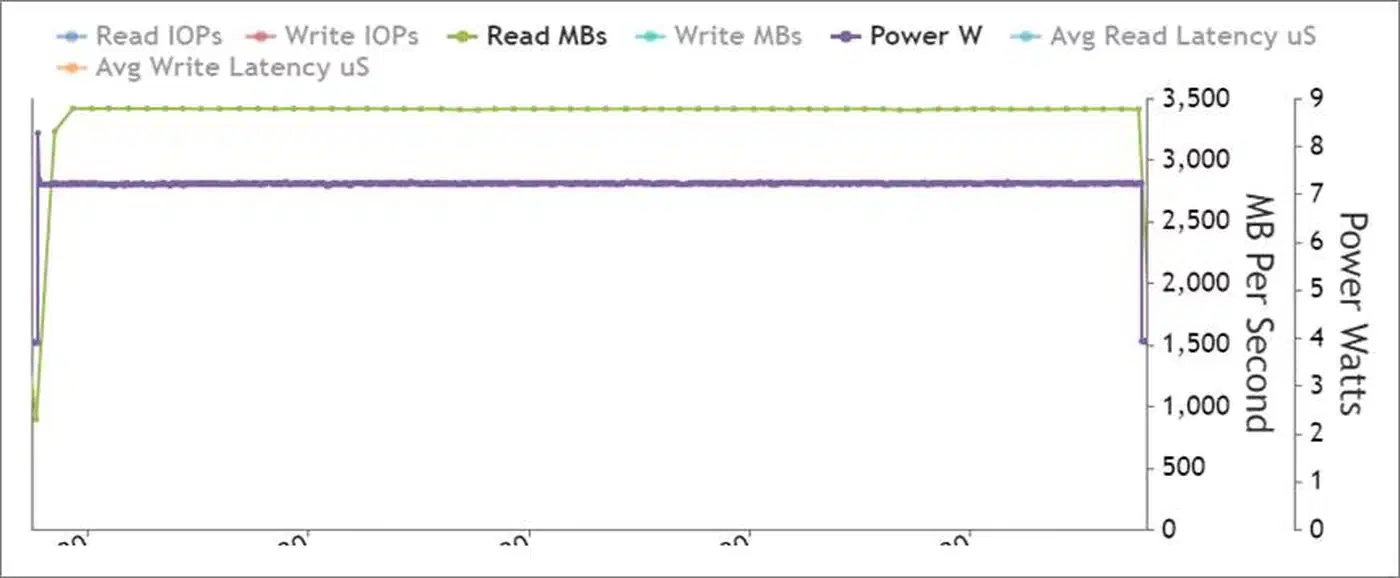
Sequential Read
fio --name=seq-read \
    --rw=read \
    --bs=1M \
    --size=4G \
    --numjobs=4 \
    --iodepth=64 \
    --ioengine=io_uring \
    --direct=1 \
    --group_reporting
This test saturates the NVMe controller with large-block sequential reads. It uses four parallel jobs and a queue depth of 64 operations. Expected results: 12,000-14,000 MB/s on Gen5, 6,500-7,000 MB/s on Gen4, 3,000-3,500 MB/s on Gen3.
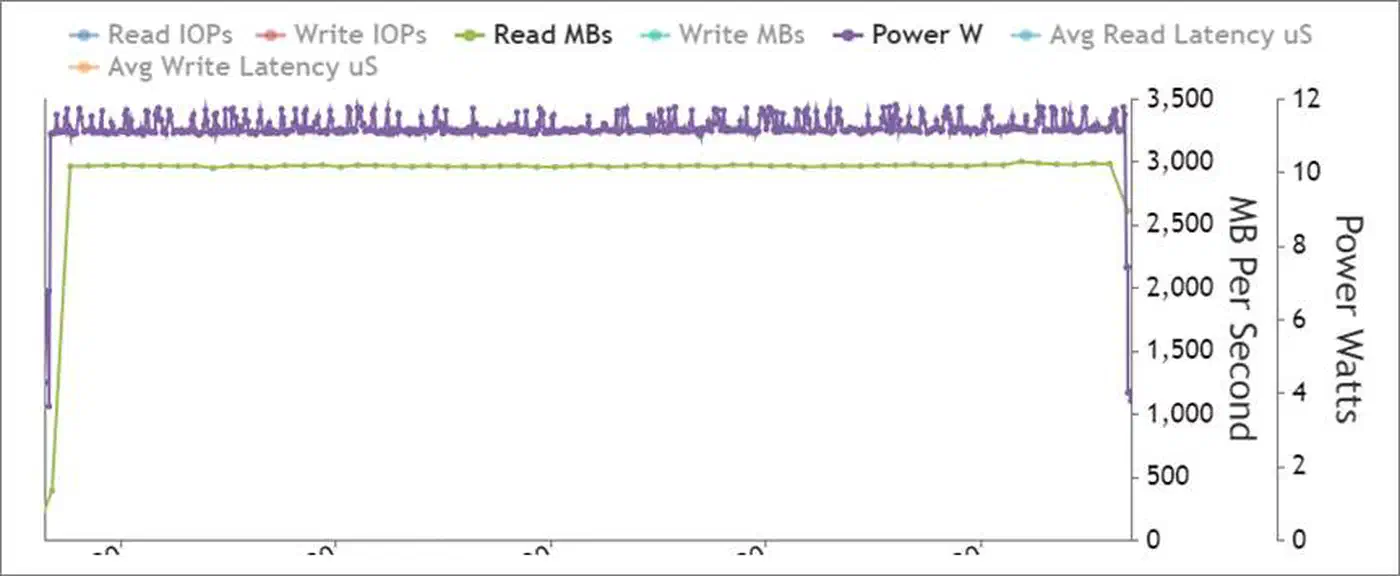
Sequential Write
fio --name=seq-write \
    --rw=write \
    --bs=1M \
    --size=4G \
    --numjobs=4 \
    --iodepth=64 \
    --ioengine=io_uring \
    --direct=1 \
    --group_reporting
Sequential write speed is where budget Gen5 drives often show their compromises. Drives with large SLC write caches (50-200GB) hit peak speeds during the test at 4GB size. Raise the test to --size=256G to drain the SLC cache and measure sustained write speed. Many Gen5 drives drop from a 12,000 MB/s peak to 3,000-5,000 MB/s once the cache fills. This is expected, but worth knowing if your work involves long, large writes (VM image transfers, video editing).
Random 4K Read (Queue Depth 32)
fio --name=rand-read \
    --rw=randread \
    --bs=4k \
    --size=1G \
    --numjobs=4 \
    --iodepth=32 \
    --ioengine=io_uring \
    --direct=1 \
    --group_reporting
This is the most useful test for everyday workloads. Random 4K IOPS sets how fast your drive responds during package builds, container image extraction, database queries, and app startup. Expected: 1,200,000+ IOPS on Gen5, 700,000-1,000,000 IOPS on Gen4, 400,000-600,000 IOPS on Gen3.
Random 4K Mixed Read/Write (70/30)
fio --name=rand-mixed \
    --rw=randrw \
    --rwmixread=70 \
    --bs=4k \
    --size=1G \
    --numjobs=4 \
    --iodepth=32 \
    --ioengine=io_uring \
    --direct=1 \
    --group_reporting
This mimics database and development workloads where reads dominate but writes never stop. The 70/30 read/write mix is a standard workload model (JESD219 Annex D). Results land lower than the pure read test on both reads and writes, which is expected. The combined IOPS figure is the metric to watch here.
Key parameter explanations:
--direct=1skips the Linux page cache. Without it, you measure RAM speed after the first pass. Always use--direct=1for drive benchmarking.--ioengine=io_uringuses the modern kernel async I/O interface added in Linux 5.1. It is faster and uses less CPU thanlibaio. If your kernel is older than 5.1, use--ioengine=libaioinstead.--iodepth=64queues 64 operations at once. NVMe supports up to 65,535 commands per queue and up to 65,535 queues. To saturate the controller, you need enough depth to keep it busy.--numjobs=4creates four separate processes, each with its owniodepth=64queue. Total outstanding operations: 256. That is enough to saturate most NVMe controllers.
Interpreting Results: Gen4 vs. Gen5 Expected Performance
Raw benchmark numbers need context. Here are the expected ranges for popular drives, plus a guide for results that fall short.
Reference Ranges
Gen5 NVMe (Crucial T705, Samsung 990 EVO Plus Gen5, WD Black SN8100):
- Sequential read: 12,000-14,400 MB/s
- Sequential write: 11,000-12,500 MB/s
- Random 4K read: 1,200,000-1,500,000 IOPS
- Random 4K write: 1,400,000-1,600,000 IOPS
Gen4 NVMe (Samsung 990 Pro, WD Black SN850X, Crucial T500):
- Sequential read: 6,500-7,450 MB/s
- Sequential write: 6,000-6,900 MB/s
- Random 4K read: 800,000-1,000,000 IOPS
- Random 4K write: 900,000-1,200,000 IOPS
Gen3 NVMe (Samsung 970 EVO Plus, WD Black SN750):
- Sequential read: 3,000-3,500 MB/s
- Sequential write: 2,500-3,300 MB/s
- Random 4K read: 400,000-600,000 IOPS
Diagnosing Below-Expected Results
Heat throttling is the most common cause of poor Gen5 speed. Check the drive temperature during the benchmark:
sudo nvme smart-log /dev/nvme0 | grep temperatureMost Gen5 drives start throttling at 70-75°C and throttle hard at 80°C. If you see temperatures in this range, the drive needs better airflow or a heatsink. Heatsinks for M.2 drives cost $5 to $25 and reliably improve sustained speed.
PCIe link speed mismatch is the second most common cause. A Gen5 NVMe drive in a Gen3 M.2 slot will deliver Gen3 speed no matter what the spec sheet says. Verify the actual link speed:
sudo lspci -vv | grep -A 20 "Non-Volatile"Look for LnkSta: in the output. It should show Speed 32GT/s for Gen5 (PCIe 5.0), 16GT/s for Gen4, or 8GT/s for Gen3. If it shows a lower speed than expected, the slot or CPU does not support the drive’s generation. Check your motherboard manual. Many boards have several M.2 slots running at different PCIe generations.
Power management throttling can be checked with:
cat /sys/class/nvme/nvme0/power_stateIf the drive is in a low-power state, the kernel or firmware is throttling it. This is more common on laptops with aggressive power management turned on.
Filesystem overhead adds 5-15% latency next to raw block device benchmarks. A benchmark against the raw device (/dev/nvme0n1) shows higher numbers than one against a mounted filesystem. ext4 and XFS add little overhead. Btrfs with transparent compression adds 10-30% write overhead, but it can raise effective throughput for compressible data by cutting the bytes actually written. ZFS behaves much the same way.
Automation and Continuous Monitoring
A one-time benchmark tells you where your drive stands today. Regular monitoring catches the slow decay that comes before drive failure. It lets you swap a drive before data loss rather than after.
Automated Benchmark Logging
Create a benchmark script that runs the four fio tests, parses their JSON output, and adds the results to a CSV log:
#!/bin/bash
# /usr/local/bin/ssd-benchmark.sh
DEVICE=${1:-/dev/nvme0n1}
TIMESTAMP=$(date +%Y-%m-%dT%H:%M:%S)
LOG=/var/log/ssd-benchmark.csv
TESTDIR=/tmp/fio-test
mkdir -p $TESTDIR

run_fio() {
    local name=$1
    local rw=$2
    local bs=$3
    fio --name=$name --rw=$rw --bs=$bs --size=2G \
        --numjobs=4 --iodepth=32 --ioengine=io_uring \
        --direct=1 --group_reporting --output-format=json \
        --filename=$TESTDIR/fio-testfile 2>/dev/null \
    | python3 -c "
import json,sys
d=json.load(sys.stdin)
j=d['jobs'][0]
bw=j['read']['bw']+j['write']['bw']
iops=j['read']['iops']+j['write']['iops']
print(f'{bw},{iops}')
"
}

SEQ_READ=$(run_fio seq-read read 1M)
SEQ_WRITE=$(run_fio seq-write write 1M)
RAND_READ=$(run_fio rand-read randread 4k)
RAND_MIXED=$(run_fio rand-mixed randrw 4k)

echo "$TIMESTAMP,$SEQ_READ,$SEQ_WRITE,$RAND_READ,$RAND_MIXED" >> $LOG
echo "Benchmark complete. Results appended to $LOG"
rm -rf $TESTDIR
Make it executable and run it:
sudo chmod +x /usr/local/bin/ssd-benchmark.sh
sudo /usr/local/bin/ssd-benchmark.sh
Scheduling Monthly Benchmarks with systemd
Create a systemd service and timer to run the benchmark on its own:
# /etc/systemd/system/ssd-benchmark.service
[Unit]
Description=Monthly SSD benchmark

[Service]
Type=oneshot
ExecStart=/usr/local/bin/ssd-benchmark.sh /dev/nvme0n1
# /etc/systemd/system/ssd-benchmark.timer
[Unit]
Description=Run SSD benchmark monthly
[Timer]
OnCalendar=monthly
Persistent=true
[Install]
WantedBy=timers.targetEnable the timer:
sudo systemctl daemon-reload
sudo systemctl enable --now ssd-benchmark.timer
SMART Monitoring with smartd
Set up smartd for round-the-clock NVMe health monitoring. Edit /etc/smartd.conf:
# Monitor all NVMe drives, check daily, email on critical issues
/dev/nvme0 -a -n standby -s L/../../1/02 -m root -M exec /usr/share/smartmontools/smartd-runner
The key NVMe SMART attributes to watch:
percentage_used: drive wear percentage (alert at 90%+)available_spare: remaining replacement block percentage (alert below 10%)critical_warning: any non-zero value points to a hardware fault that needs quick attentiontemperature: running temperature; alert above 75°C for sustained work
Enable and start smartd:
sudo systemctl enable smartd
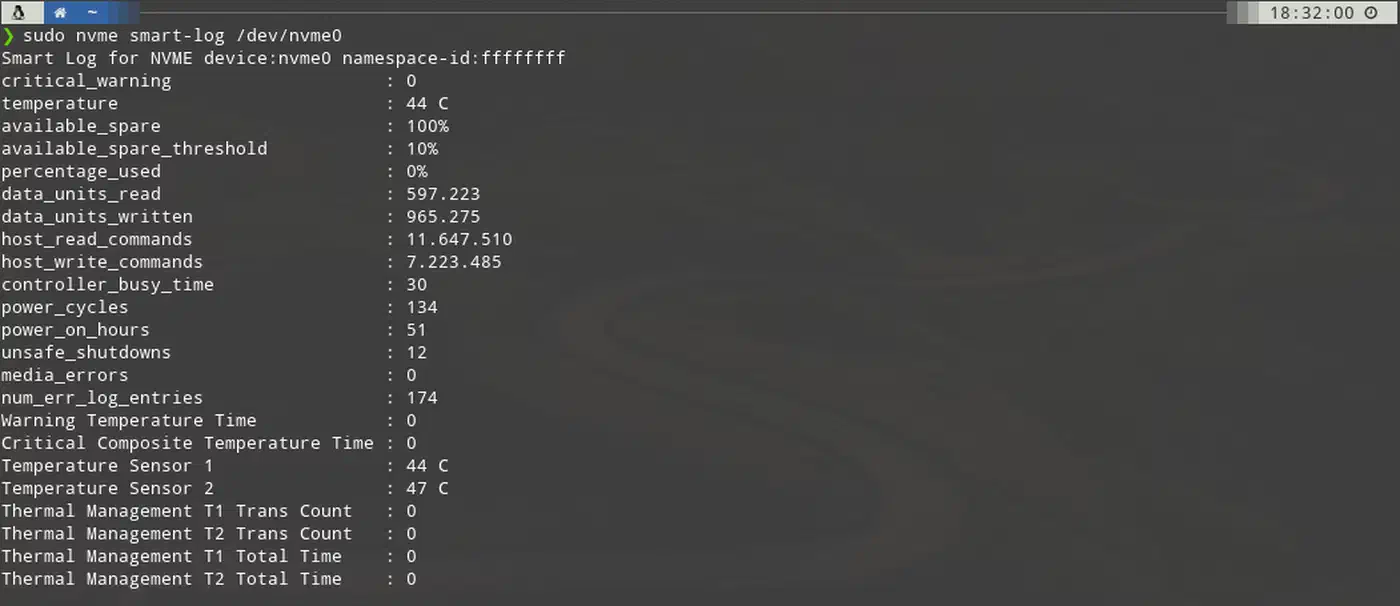
sudo systemctl start smartdFor one-off NVMe health checks, nvme-cli gives detailed information beyond SMART:
# Full SMART log
sudo nvme smart-log /dev/nvme0

# Drive controller info including firmware version and PCIe link details
sudo nvme id-ctrl /dev/nvme0

# Check for any logged errors
sudo nvme error-log /dev/nvme0
Interpreting Benchmark Trends Over Time
Once you have a few months of benchmark data in your CSV log, you can chart trends. A 5-10% speed drop over two years is normal and expected as the drive’s write amplification factor rises with wear. A 20%+ drop in random IOPS calls for a closer look. Check SMART data for more media errors, higher temperature during use, or a drop in available spare capacity. A sudden large drop (40%+) in sequential speeds often means the drive has entered a degraded mode and should be replaced soon.
Pairing regular fio benchmarks with round-the-clock smartd monitoring gives you both the speed baseline and the health signal needed to manage NVMe drives with confidence over their lifetime.