 Botmonster Tech
Intel Arc 140V on Linux: the best GPU control panel apps and driver setup

Got a Lunar Lake laptop and went looking for Intel’s Arc Control app on Linux? It doesn’t exist. Intel only ships Arc Control for Windows. Linux users get a community tool instead: LACT, the Linux GPU Configuration and Monitoring Tool. It covers temperature, power limits, clock speeds, and voltage through a proper GUI. For live performance data, intel_gpu_top and nvtop handle the rest from the terminal.
Below: driver setup, LACT installation, CLI monitoring tools, power tuning, and the most common things that go wrong on a fresh install.
Intel Arc 140V and the Lunar Lake Architecture
The Arc 140V is Intel’s integrated GPU in the Core Ultra 200V (Lunar Lake) chip series. It launched in late 2024 and still leads the 2026 thin-and-light market. It ships with 8 Xe-cores and hardware ray tracing support. Those specs put it head to head with AMD’s Radeon 890M from the Strix Point platform.
On paper and in practice, the Arc 140V handles 1080p gaming well under Linux. Titles running through Proton usually land between 40-70 fps at medium settings, with heavier open-world games near the lower end. AV1 hardware encoding and decoding is where it stands out. The dedicated media engine handles 4K AV1 transcoding at real-time speeds with low CPU overhead, as long as the driver stack is set up right.
The big shift for Linux users is the move away from the old i915 kernel driver. Previous Intel integrated graphics (Tiger Lake, Alder Lake, Raptor Lake) all ran on i915. Lunar Lake uses the new xe driver. It was upstreamed into the Linux kernel in version 6.8, but reached production-ready quality for Lunar Lake around kernel 6.12. The xe driver is not a minor update. It’s a full rewrite of the kernel graphics driver, with a new memory model, a new firmware interface, and a new sysfs layout. Many monitoring tools and power scripts written for i915 don’t transfer directly.
If your distro ships kernel 6.11 or older, you’re in for a rough time. Kernel 6.12+ is the practical minimum for stable daily use on Arc 140V hardware.
The Modern Driver Stack: Kernel 6.12+ and Mesa 24.2+
Getting the driver stack right is the base everything else builds on. There are three parts to check: the kernel driver, the Mesa userspace, and the firmware binaries.
Verifying the xe kernel driver
Run this to confirm the xe driver is loaded:
lsmod | grep xeYou should see output like:
xe                   1234567  0
drm_exec               16384  1 xe
drm_suballoc_helper    16384  1 xe
drm_ttm_helper         16384  2 xe,i915
If you only see i915 and nothing for xe, your kernel is too old or the module isn’t loading. Check your running kernel with uname -r and confirm it’s 6.12 or newer.
To see which driver is managing your GPU device:
cat /sys/bus/pci/devices/*/driver_override 2>/dev/null
ls -la /sys/bus/pci/drivers/xe/
Mesa version check
Mesa provides the Vulkan driver (ANV, also called Anvil) and the OpenGL driver (Iris) for Intel hardware. The 24.2 release added heavy tuning work for the Xe-core design. Most of it lands in pipeline caching and descriptor set handling, both of which affect gaming workloads.
Check your installed version:
glxinfo -B | grep "OpenGL version"
vulkaninfo --summary | grep driverVersion
On Ubuntu 24.10 and Fedora 41+, Mesa 24.2+ ships in the default repos. On Ubuntu 24.04 LTS, you’ll need a PPA or an upgrade path. The kisak-mesa PPA is the usual pick for LTS users who want current Mesa without switching distros.
On Arch Linux, Mesa in the extra repo tracks upstream closely, so pacman -Syu is usually enough.
Firmware verification with vainfo
Hardware video acceleration on Arc 140V depends on two firmware binaries: GuC (the graphics microcontroller) and HuC (the HEVC/AVC microcontroller). Both must load correctly. Without them, video decoding falls back to software. That burns CPU cycles and kills battery life during media playback.
Install vainfo and run it:
# Debian/Ubuntu
sudo apt install vainfo

# Fedora
sudo dnf install libva-utils

# Arch
sudo pacman -S libva-utils

vainfo
A healthy output looks like:
Trying display: wayland
vainfo: VA-API version: 1.21 (libva 2.21.0)
vainfo: Driver version: Intel iHD driver for Intel(R) Gen Graphics - 24.x.x
vainfo: Supported profile and entrypoints
      VAProfileH264Main               :	VAEntrypointVLD
      VAProfileHEVCMain               :	VAEntrypointVLD
      VAProfileAV1Profile0            :	VAEntrypointVLD
      VAProfileAV1Profile0            :	VAEntrypointEncSlice
If vainfo errors out or shows no supported profiles, your firmware is missing or outdated. The fix is in the troubleshooting section below.
LACT: The Closest Thing to a Linux GPU Control Panel
LACT started as an AMD GPU tool and grew Intel support over 2024 and 2025. Current releases handle Arc 140V monitoring and basic power tuning through a clean GTK interface. It doesn’t match Windows Arc Control feature for feature, but it covers what most users need.
What LACT shows you
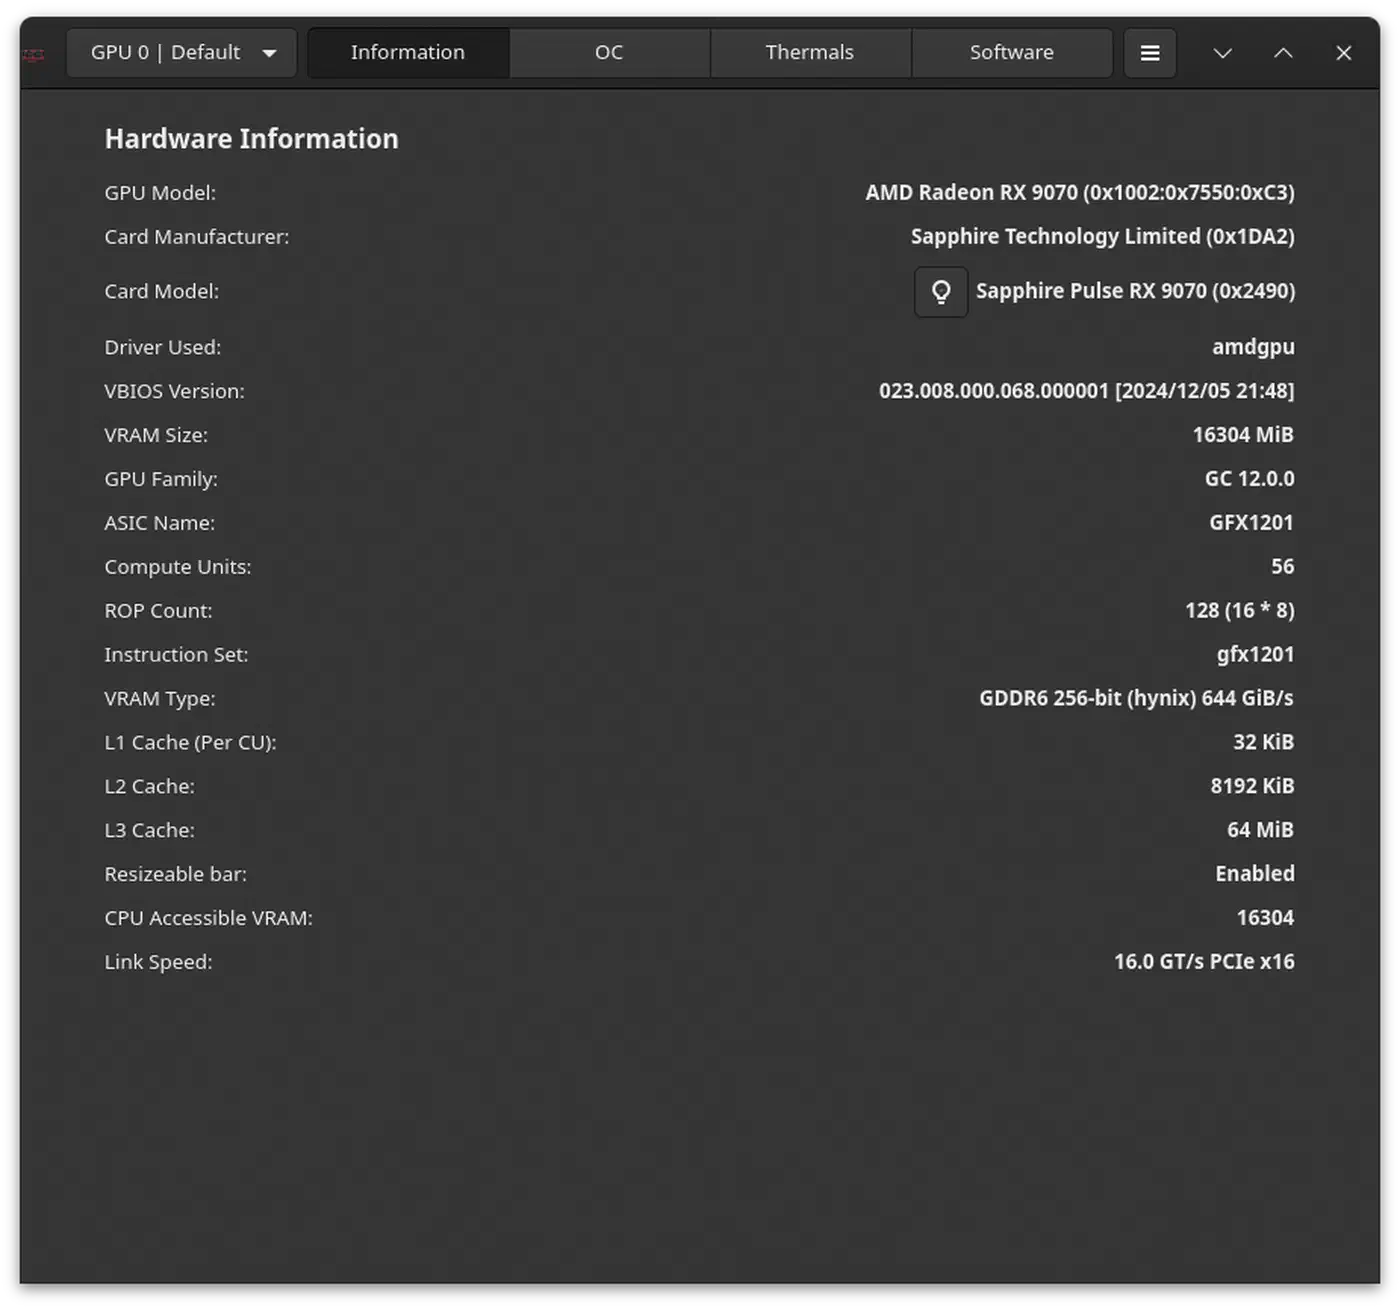
Once installed and running, LACT’s main panel covers the basics: live GPU temperature with a history graph, core and memory clock speeds, GPU usage percentage, current power draw in watts, and fan speed. Fan speed often shows N/A on laptops, since the embedded controller runs the fans, not the GPU driver.
Installing LACT
The Flatpak from Flathub is the easiest path and works on any distro:
flatpak install flathub io.github.lact_gui
flatpak run io.github.lact_gui
LACT runs a background daemon (lactd) that needs root rights to talk to the GPU. The Flatpak sets this up through a systemd service that turns on at install. If the daemon isn’t running, the GUI opens but shows no data. Check it with:
systemctl status lactd
sudo systemctl start lactd
sudo systemctl enable lactd
On Arch Linux, LACT is in the AUR:
yay -S lact
# or
paru -S lact
On Fedora, it’s available through COPR:
sudo dnf copr enable ilyaz/LACT
sudo dnf install lact
After you install through native packages, enable the daemon the same way as above.
Professional Monitoring with CLI Tools
Maybe you prefer the terminal. Or you’re doing performance analysis and need precise numbers without GUI overhead. Either way, there are three tools worth knowing.
intel_gpu_top
Part of the intel-gpu-tools package, intel_gpu_top gives you a live view of every GPU engine, broken down by usage percentage:
# Install
sudo apt install intel-gpu-tools   # Debian/Ubuntu
sudo dnf install igt-gpu-tools     # Fedora
sudo pacman -S igt-gpu-tools       # Arch

# Run
sudo intel_gpu_top
The output shows a separate row for each engine: Render/3D, Blitter, Video (the media decode/encode engine), and VideoEnhance. This per-engine view makes it easy to spot where a workload hits limits. Say you’re transcoding video and the Render engine sits at 80% while Video sits at 10%. That means the pipeline is going through software rendering, not the hardware media engine. It points to a firmware or VA-API config problem.
The -s flag sets the sample interval in milliseconds. The -d flag picks a specific device if you have more than one GPU:
sudo intel_gpu_top -s 500 -d pci:vendor=8086nvtop
nvtop shows GPU information in an htop-style interface with per-process GPU usage. Run this one when you want to know which app is hammering your GPU:
sudo apt install nvtop    # Debian/Ubuntu
sudo dnf install nvtop    # Fedora
sudo pacman -S nvtop      # Arch

nvtop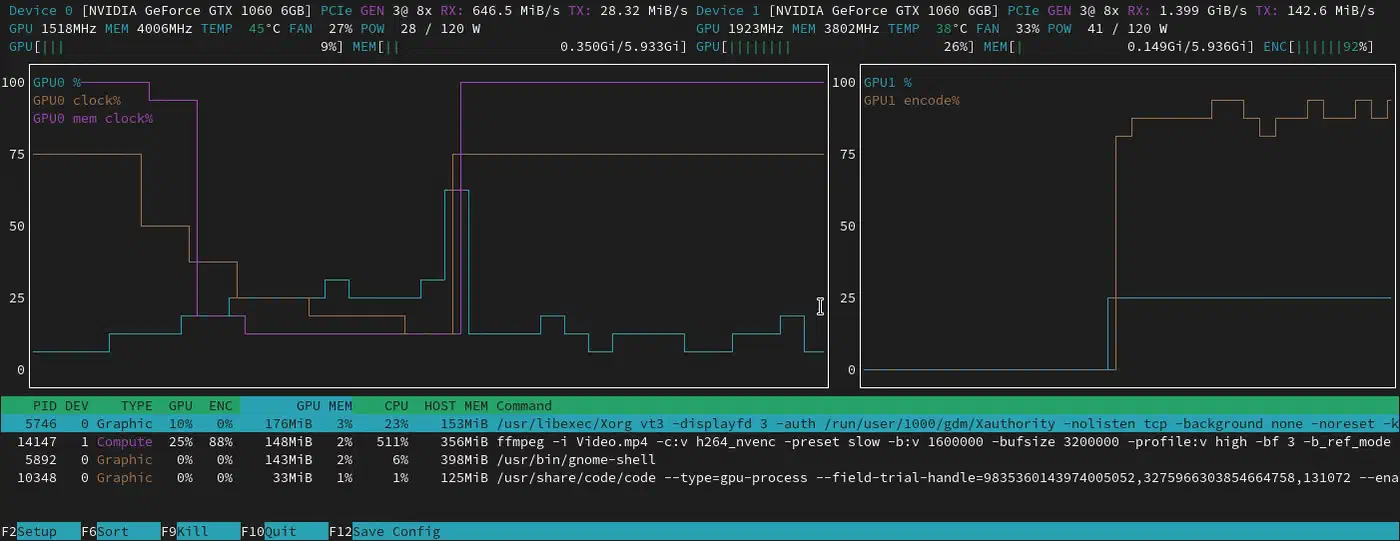
The process list at the bottom shows each app using GPU resources, with its PID, memory use, and usage percentage. It helps in a few cases: checking whether your browser’s GPU acceleration works, confirming a game is actually hitting the GPU, or making sure an AI inference job (like llama.cpp with the Vulkan backend) offloads to hardware.
nvtop gained Intel xe driver support in version 3.1.0. If your distro ships an older version, you may see your Arc 140V listed but with missing or wrong metrics.
gputop
gputop is a lighter option built around Intel’s performance monitoring unit (PMU) interface. It gives lower-level metrics that intel_gpu_top hides by default, like per-subslice shader usage and cache hit rates. It suits graphics developers debugging shader performance more than general users checking if their laptop runs hot. For most needs, intel_gpu_top and nvtop are enough.
Power Management and Thermal Optimization
Lunar Lake laptops share one power budget across CPU and GPU. So the PL1/PL2 limits you set affect both. Keep that in mind before you start sliding power limits in LACT.
Adjusting power limits
PL1 is the sustained power limit, the wattage the system can hold over long periods. PL2 is the boost limit, allowed for short bursts of 10 to 30 seconds. On a 20W TDP laptop, you might see PL1 at 20W and PL2 at 28W.
In LACT, the Power tab has sliders for both limits. On battery during light work, dropping PL1 to 10-12W cuts power use a lot without making the desktop feel slow. When plugged in for gaming, raising PL2 to the firmware maximum lets the GPU hold higher clocks during short bursts.
Changes in LACT apply at once, but don’t survive a reboot by default. To keep them, LACT has an “Apply on startup” option in settings that writes a systemd override.
Identifying thermal throttling
In thin laptops, the Arc 140V often hits thermal limits before power limits. When thermal throttling kicks in, the GPU drops its clock speed to shed heat. You can watch for this in intel_gpu_top by tracking the frequency column under load. If the frequency jumps between 1.8 GHz and 0.9 GHz at random, the cooling system isn’t keeping up.
To monitor GPU frequency directly:
watch -n 1 "cat /sys/class/drm/card*/gt_cur_freq_mhz"If you see frequent dips below 50% of the rated boost frequency during long gaming sessions, the bottleneck is your laptop’s thermal paste or fan curve, not the power limits. LACT can’t fix a cooling problem. At that point your options are a cooling pad, an undervolt (still limited on Lunar Lake), or living with the thermal cap.
Frequency pinning
On discrete Arc GPUs, you can pin the clock to a fixed frequency to cut variance, at the cost of power efficiency. On the integrated Arc 140V, the driver still restricts this. The xe driver exposes frequency range controls through sysfs (/sys/class/drm/card0/gt/gt0/freq*). But setting the minimum frequency equal to the maximum, to force a fixed clock, doesn’t work reliably on Lunar Lake with kernel 6.12. Later kernel releases may improve it.
Troubleshooting and Common Pitfalls
GPU not found / xe driver not loading
If LACT shows no GPU, or intel_gpu_top exits right away with an error, start by confirming the driver loaded:
lsmod | grep xe
dmesg | grep -i xe | head -40
If xe isn’t in lsmod output, check whether the module exists:
find /lib/modules/$(uname -r) -name "xe.ko*"If it’s missing entirely, your kernel doesn’t have xe built in or as a module. The fix is to upgrade to kernel 6.12+. On Ubuntu 24.04, the HWE kernel track gets you there:
sudo apt install linux-generic-hwe-24.04Screen tearing
On X11, Intel’s xe driver uses the modesetting DDX by default. That DDX doesn’t support the old TearFree option from the legacy intel DDX. A compositor with vsync turned on fixes it, and most desktop environments enable that out of the box. Or you can switch to Wayland entirely.
On Wayland with GNOME or KDE, tearing should be gone by default, since the compositor controls presentation timing. If you’re still seeing a horizontal split in the picture, confirm the compositor runs in hardware-accelerated mode:
WAYLAND_DEBUG=1 weston-info 2>&1 | grep renderer
# or for GNOME
gsettings get org.gnome.mutter experimental-features
Missing or outdated firmware
If vainfo shows errors or no supported profiles, the GuC/HuC firmware files may be missing or outdated. Check what’s loaded:
dmesg | grep -i "huc\|guc" | head -20If you see “firmware not found” or version mismatch warnings, update the linux-firmware package:
# Debian/Ubuntu
sudo apt update && sudo apt install --reinstall linux-firmware

# Fedora
sudo dnf update linux-firmware

# Arch
sudo pacman -S linux-firmware
If your distro’s package lags well behind upstream, you can pull the latest firmware straight from the linux-firmware git repository and copy the Intel files by hand:
git clone --depth=1 https://git.kernel.org/pub/scm/linux/kernel/git/firmware/linux-firmware.git
sudo cp linux-firmware/i915/* /lib/firmware/i915/
sudo update-initramfs -u   # Debian/Ubuntu
# or
sudo dracut --force         # Fedora/RHEL
Reboot after updating firmware so the new binaries get picked up when the driver starts.
The Arc 140V is a solid GPU for Linux in 2026. The driver situation has settled down since the rocky early days of the xe switch. LACT covers the GUI monitoring and power tuning that most users need. The CLI tools fill in where the GUI falls short. The one hard rule is to run a current software stack. Old kernels and old Mesa versions will cap your performance well below what the hardware can do.