Track Your Home's Energy Usage with Home Assistant

The average American household spends about $1,500 a year on electricity. Most of it walks out the door with no clear sense of where. Your utility’s smart meter reports yesterday’s total. It won’t tell you that an old game console pulls 30W while it sits “off,” or that your water heater runs right when grid prices peak. Home Assistant fixes that. Pair the right hardware with the built-in Energy Dashboard, and you get per-device, per-circuit visibility.
Why Monitor Home Energy Usage?
Start with behavior. Studies show that homes with real-time energy data cut use by 10 to 15 percent, with no other changes. Visibility creates accountability. Watch the meter tick up live, and leaving lights on starts to feel wasteful. So does running a half-empty dishwasher. A monthly bill never gets that across.
Standard AMI smart meters are a start. These are the digital ones your utility likely installed already. Still, they fall short. They report daily or hourly kWh totals, often through a utility portal with a 24-hour lag. That’s no help in the moment. The Energy Dashboard drops to a single circuit and updates every few seconds.
A big win from real-time data is spotting “vampire loads”: devices that pull 5 to 50 watts non-stop in standby. Think TVs, game consoles, desktops, streaming boxes, and network gear. Each seems tiny. Together they can soak up 10 percent or more of a yearly bill. Once you see them, smart plugs and automations switch them off for good.
The last reason is dynamic pricing. Time-of-Use (TOU) tariffs are now the default in many regions. Power can cost two or three times more in the evening peak than at 2 AM. Shift your dishwasher, washing machine, and EV charger to run off-peak. Trigger them from live price signals instead of a fixed clock, and the savings pile up.
Monitoring Hardware Options
The right hardware depends on what you want to measure and how comfortable you are inside a breaker panel. Three main types cover it.
Whole-home CT clamp monitors are the best entry point for most homes. Current transformer (CT) clamps snap around the main feed cables in your breaker panel, with no need to cut power. The clamp senses a small current that tracks the wire and gives you live watt readings.
Circuit-level monitors go further. They put a CT sensor on each breaker, so you see usage by circuit, not just the whole-home total.
Smart plugs handle single appliances you want to track on their own: a chest freezer, a server rack, or an EV charger plugged into a standard outlet.
| Device | Price (approx.) | Accuracy | Circuits | HA Integration | Local API |
|---|---|---|---|---|---|
| Shelly EM3 | ~$45 | ±1% | 3 (whole-home or 3 circuits) | Native (local) | Yes |
| Emporia Vue Gen 3 | ~$80 | ±2% | 16 circuits | Native (local, 2026) | Yes |
| IotaWatt | ~$120 | ±0.5% | Up to 14 circuits | Native (local) | Yes |
| Sense Home Energy Monitor | ~$299 | ±1% | Whole-home + ML appliance ID | Via cloud integration | No |
| TP-Link Kasa Smart Plug | ~$15 | ±2% | Per-plug | Native (local) | Yes |
| IKEA TRETAKT (Zigbee) | ~$10 | ±2% | Per-plug | Via Zigbee2MQTT or ZHA | Yes |
| Shelly Plug S | ~$18 | ±1% | Per-plug | Native (local) | Yes |
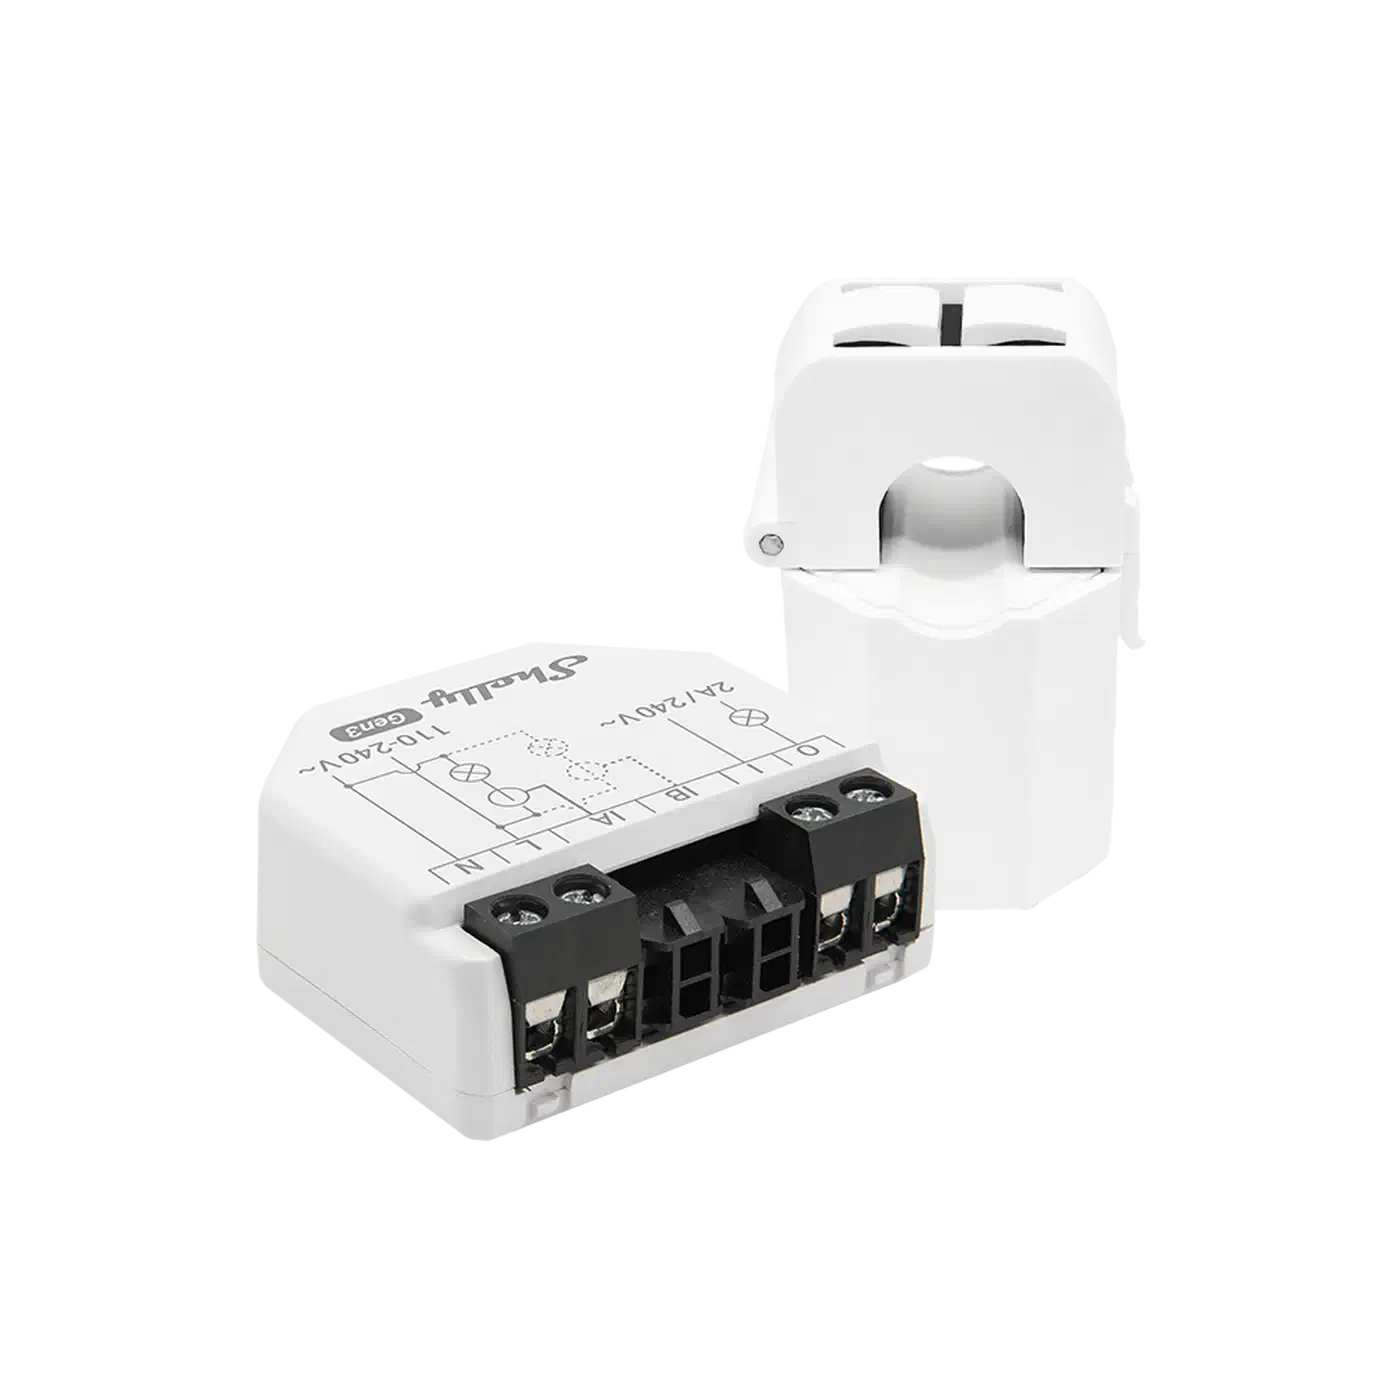
The Shelly EM3 is the practical starting point for most people. It handles three-phase setups, runs on local Wi-Fi with no cloud, and ships with a mature native Home Assistant integration. You get power, voltage, current, and energy sensors out of the box.
The Emporia Vue Gen 3 gives circuit-level detail without IotaWatt prices. Its 16-sensor kit covers a typical panel. A fully local API now drops the cloud link that earlier models needed.
The IotaWatt is the gold standard for precision. Its ±0.5% accuracy, open-source firmware, and local web API make it the pick for billing-accurate reports. For solar owners tracking feed-in credits to the cent, that accuracy pays for itself.
The Sense monitor takes a different tack. It runs machine learning on the waveform of your main feed and tags appliances by their electrical “fingerprint.” Results impress when they work. Still, the detection is only a guess, the device is cloud-only, and $299 is a steep buy-in.
A Safety Note on CT Clamp Installation
Working inside a breaker panel is dangerous. The main lugs, the thick cables entering the top of the panel from the utility, carry line voltage. No breaker protects them. They stay live whenever utility power is on, even with your main breaker off.
If you are not at ease around live conductors, hire a licensed electrician. The CT clamps themselves are low-voltage and safe to handle. Fitting them, though, means reaching past the live main lugs. Many regions also require a permit to open the main panel, so check local rules first.
If you go ahead yourself: work slowly, use insulated tools, and don’t touch the main lugs or bus bars. Wear rubber gloves rated for the panel voltage. Snap the CT clamps around the conductors before wiring them to the monitor, and mount the monitor outside the panel.
Setting Up the Home Assistant Energy Dashboard
Once your hardware’s sensors show up in Home Assistant, the Energy Dashboard takes about ten minutes to set up. Go to Settings → Energy to open the wizard.
The wizard splits energy sources into four buckets: Grid Consumption, Grid Return (solar feed-in), Solar Production, and Battery Storage. For a basic setup, you only need Grid Consumption.
The key idea: the dashboard needs sensors that report energy in kilowatt-hours (kWh), not live power in watts. The Shelly EM3 reports both. Pick the energy entity, not the power entity. If your device gives only a watt sensor, a helper converts it.
The integration helper (or its YAML form, riemann_sum_integral) does the conversion:
# configuration.yaml
sensor:
  - platform: integration
    source: sensor.my_device_power
    name: "My Device Energy"
    unit_prefix: k
    round: 2
    method: left
That makes a new sensor (sensor.my_device_energy) that adds up kilowatt-hours from the watt readings. Add it to the dashboard and Home Assistant handles the rest.
For solar production, pick the kWh sensor from your inverter integration. Fronius, SolarEdge, and Enphase all expose it directly. If you send power back to the grid, set the Grid Return field to your feed-in kWh sensor. That switches on net metering. The dashboard then shows solar made, used, and sold for credit.
Battery storage needs two sensors: one for energy charged in, one for energy drawn out. They stay split because charging isn’t 100% efficient. The dashboard tracks round-trip efficiency from the gap between the two.
Device-level tracking handles up to ten appliances. Add your smart plug sensors here: the washing machine, the chest freezer, the gaming PC. Each shows up by name in the device breakdown, with daily, weekly, and monthly kWh totals and costs.
Identifying Energy Hogs with Statistics
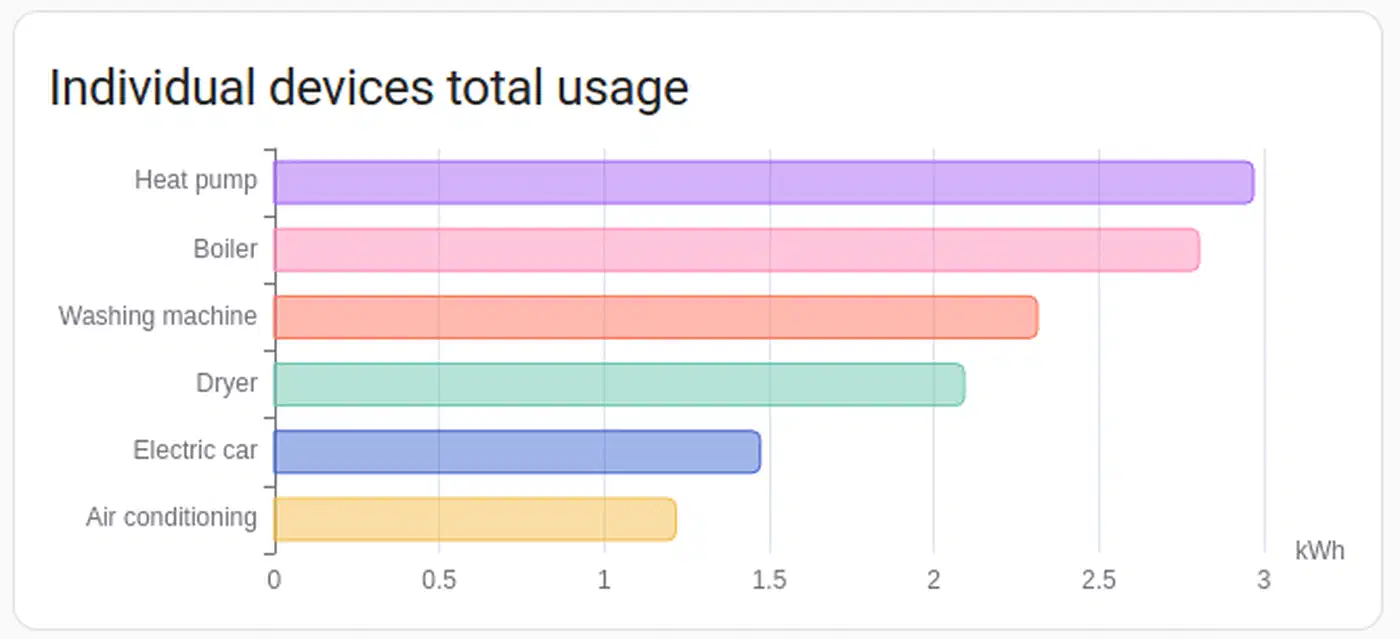
Once the dashboard fills up, the analysis starts. The device breakdown panel is the most useful view. It ranks your tracked devices by energy use over any time window. If your server eats more kWh per month than your fridge, that jumps right out.
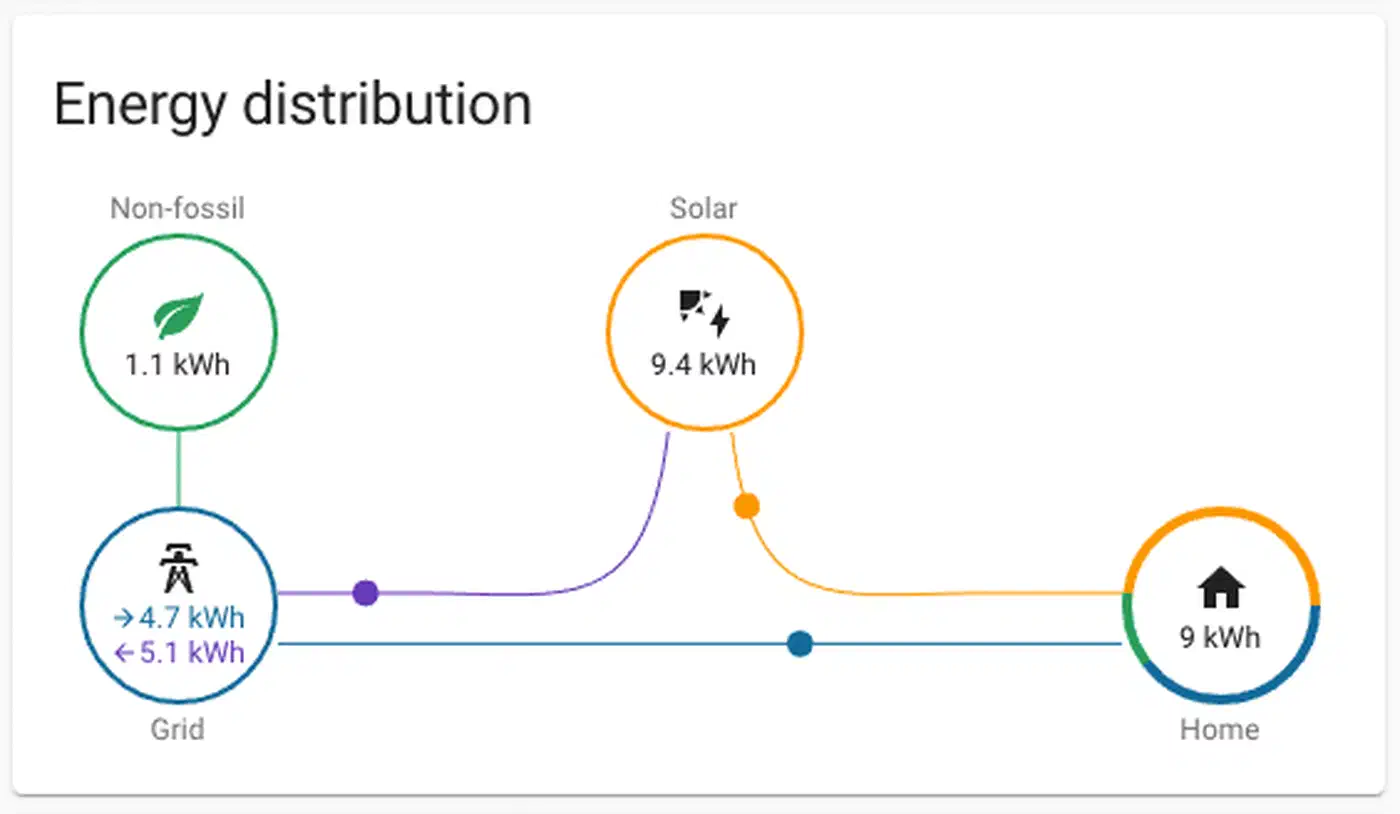
The “Power Flow” card shows live energy flow as an animated diagram. Solar feeds the home and battery. The grid covers any gap. Heavy-draw devices show up as labeled branches. It’s the best way to share your home’s energy state with the family. A wall-mounted DIY smart mirror with Home Assistant integration makes a great home for it, seen without anyone reaching for a phone.
The Statistics developer tool (under Developer Tools → Statistics) exports sensor history to CSV. Drop it into a spreadsheet. Then ask things like “what share of my use falls between 4 PM and 9 PM.” That kind of answer pushes people to shift habits.
Standby power is worth a special look. A template sensor takes the wattage of devices you know are on, and subtracts it from the whole-home total:
# configuration.yaml
template:
  - sensor:
      - name: "Baseline Standby Power"
        unit_of_measurement: "W"
        state: >
          {% set total = states('sensor.grid_power') | float(0) %}
          {% set known = states('sensor.server_power') | float(0)
                       + states('sensor.ev_charger_power') | float(0)
                       + states('sensor.washing_machine_power') | float(0) %}
          {{ [total - known, 0] | max | round(1) }}
When this sensor reads 80W at 3 AM with the house empty, you’ve found your vampire load budget. Flip smart plugs off one by one and watch it drop.
The history_stats integration is also great for spotting usage patterns:
sensor:
  - platform: history_stats
    name: "Washing Machine Daily Runtime"
    entity_id: binary_sensor.washing_machine_running
    state: "on"
    type: time
    start: "{{ now().replace(hour=0, minute=0, second=0) }}"
    end: "{{ now() }}"
Automating Based on Energy Data
Visibility is good. Automation is where the real shift happens. Home Assistant’s energy sensors become triggers for rules that trim your use on their own.
EV Charger Scheduler: Don’t charge on a fixed overnight schedule. Start a charge when the grid price drops below a set point. Use the Octopus Energy integration (UK) or Tibber (US/EU):
automation:
  - alias: "EV Charging - Start on Cheap Rate"
    trigger:
      - platform: numeric_state
        entity_id: sensor.octopus_energy_electricity_current_rate
        below: 0.10
    condition:
      - condition: numeric_state
        entity_id: sensor.ev_battery_level
        below: 85
    action:
      - service: switch.turn_on
        target:
          entity_id: switch.ev_charger
Standby Cutter: When total home use drops below 150W (everyone asleep or out), shut off known vampire loads:
automation:
  - alias: "Standby Power Cutter"
    trigger:
      - platform: numeric_state
        entity_id: sensor.grid_power
        below: 150
        for:
          minutes: 10
    action:
      - service: switch.turn_off
        target:
          entity_id:
            - switch.living_room_tv_plug
            - switch.gaming_console_plug
            - switch.office_monitor_plug
Solar Surplus Router: Sometimes solar output beats home use by 500W for ten minutes. That extra power would otherwise export for a small credit. Send it to a water heater or pool pump instead:
automation:
  - alias: "Solar Surplus - Heat Water"
    trigger:
      - platform: template
        value_template: >
          {{ (states('sensor.solar_power') | float(0) -
              states('sensor.home_consumption_power') | float(0)) > 500 }}
        for:
          minutes: 10
    action:
      - service: switch.turn_on
        target:
          entity_id: switch.water_heater_boost
The utility_meter integration lines reporting up with your billing cycle:
utility_meter:
  daily_energy:
    source: sensor.grid_energy_total
    cycle: daily
  monthly_energy:
    source: sensor.grid_energy_total
    cycle: monthly
  monthly_energy_peak:
    source: sensor.grid_energy_total
    cycle: monthly
    tariffs:
      - peak
      - offpeak
That makes separate sensors that reset at each cycle boundary. They line up with your utility’s billing period and track TOU tariff periods on their own.
Integrating Dynamic Energy Pricing
Flat per-kWh rates are getting rare. Most utilities now offer (or push) Time-of-Use tariffs. Some offer fully dynamic pricing tied to wholesale market rates.
Octopus Energy (UK) offers the Agile tariff . Prices refresh every 30 minutes from wholesale rates. The Octopus Energy Home Assistant integration turns current and forecast prices into sensors. That makes smart scheduling easy. It also has native EV charging that talks to the car’s API.
Amber Electric (Australia) does the same for wholesale prices. Its integration works the same way. A sensor reports the current spot price in cents per kWh. Use it as a trigger or condition in any automation.
In the Nordics, the Nord Pool and Energi Data Service integrations pull day-ahead spot prices the same way. Energi Data Service also adds VAT and tariff handling for Danish regions.
In the US, Tibber
offers real-time pricing in some markets. Without a direct integration, scrape TOU data into a rest sensor. You can also use a schedule helper that mirrors your utility’s peak and off-peak windows.
A clean pattern is a binary_sensor that boils it down to “is power cheap right now?”:
template:
  - binary_sensor:
      - name: "Electricity Cheap Rate"
        state: >
          {{ states('sensor.current_electricity_rate') | float(0) < 0.12 }}
        device_class: power
Use this sensor as a condition in any automation with flexible timing: the dishwasher, the washing machine, pre-heating or pre-cooling the house. Each then adapts on its own as your tariff shifts.
One pattern works really well: read tomorrow’s high from the weather forecast integration. If it’s above 35°C (95°F) and the rate is cheap, pre-cool the house an hour before peak opens. A well-insulated home holds that cool through hours of pricey peak rates, so the AC runs when power is cheapest.
Frequently Asked Questions
How much power does the Home Assistant Green hub use?
Very little. The official datasheet rates the Home Assistant Green at about 1.7W idle and roughly 3W under load. Running non-stop, that idle figure works out to under 15 kWh a year, a couple of dollars on most tariffs. The hub is one device you can leave off the vampire-load list. To confirm it, put the Green’s adapter on a smart plug and watch the reading.
Can Home Assistant read my smart meter directly?
Often, yes. Many European meters have a P1 port. That’s the DSMR “slimme meter” standard, used in the Netherlands, Belgium, Luxembourg, and Sweden. A USB or Wi-Fi P1 cable feeds that data into the built-in DSMR Smart Meter integration. You get live whole-home consumption with no breaker-panel work. Outside DSMR regions, support is patchier. Some utilities offer a partner integration; others leave a CT clamp as the only real-time option.
Does Home Assistant support my electricity provider?
It depends on the provider, and the list keeps growing. Octopus, Amber, and Tibber are covered. So are Nordic spot prices, through Nord Pool and the Danish Energi Data Service. Region-specific utilities like Dominion Energy and Origin Energy have integrations too. Search the directory for your provider by name. If nothing exists, a rest sensor scraping your utility’s published rates covers most cases.
What is the difference between grid power and grid consumption?
Grid power is an instant reading in watts: what your home draws right now. Grid consumption is energy over time, in kilowatt-hours. The Energy Dashboard runs on consumption (kWh) sensors. The Power Flow card and automations use power (W) sensors. If your monitor reports only watts, the integration helper above converts it to a kWh sensor.
Putting It All Together
Build this up step by step. Start with a Shelly EM3 on your main panel feed and watch the Energy Dashboard for a week; your biggest consumers show up within days. Then add smart plugs to the top two or three and build the standby-cutter automation. If you have solar, connect the inverter integration. If your utility offers TOU or dynamic pricing, layer in the pricing integration and let the automations schedule for you.
Each stage adds visibility, then control, then savings you can measure. The 10 to 15 percent cut from behavior change is a floor, not a ceiling. Homes with solar, batteries, EVs, and dynamic pricing report 25 to 40 percent cuts against an unmonitored baseline. Unlike most smart home projects, this one pays for itself fast.