 Botmonster Tech
code-review-graph trims 82x tokens on a typical repo

code-review-graph MCP token reduction runs about 82 times on a median repository. The widely shared 528 times figure is one repo’s best case, and the project labels it that way in its own benchmark table.
Key Takeaways
- Your AI tool re-reads the same code every review, and you pay for every read.
- A parsed map of your codebase lets it read only the files a change touches.
- The typical saving is about 82 times, well under the 528 figure people quote.
- One install command sets up every AI coding tool it finds on your machine.
- The graph is built and queried locally, so no source code leaves the machine.
Why your AI assistant keeps re-reading the same code
Ask an agent how authentication works and watch what it does. It greps, opens a dozen files, answers, then throws all of that away. The next question starts from zero, because nothing carries structure between turns.
That waste has an upper bound you can measure: the size of the source tree. tirth8205/code-review-graph benchmarks it directly, and its numbers put FastAPI at about 951,000 tokens of source, Flask at 125,000, and Express at 136,000.
Monorepos are where it hurts most, because the share of files a change touches collapses. The project reports over 27,700 files excluded from one review context, with roughly 15 files actually read.
The fix is to parse the repo once and keep the result. Tree-sitter turns each file into a syntax tree. Nodes are functions, classes, and imports; edges are calls, inheritance, and test coverage. Both land in a SQLite file inside your repo.

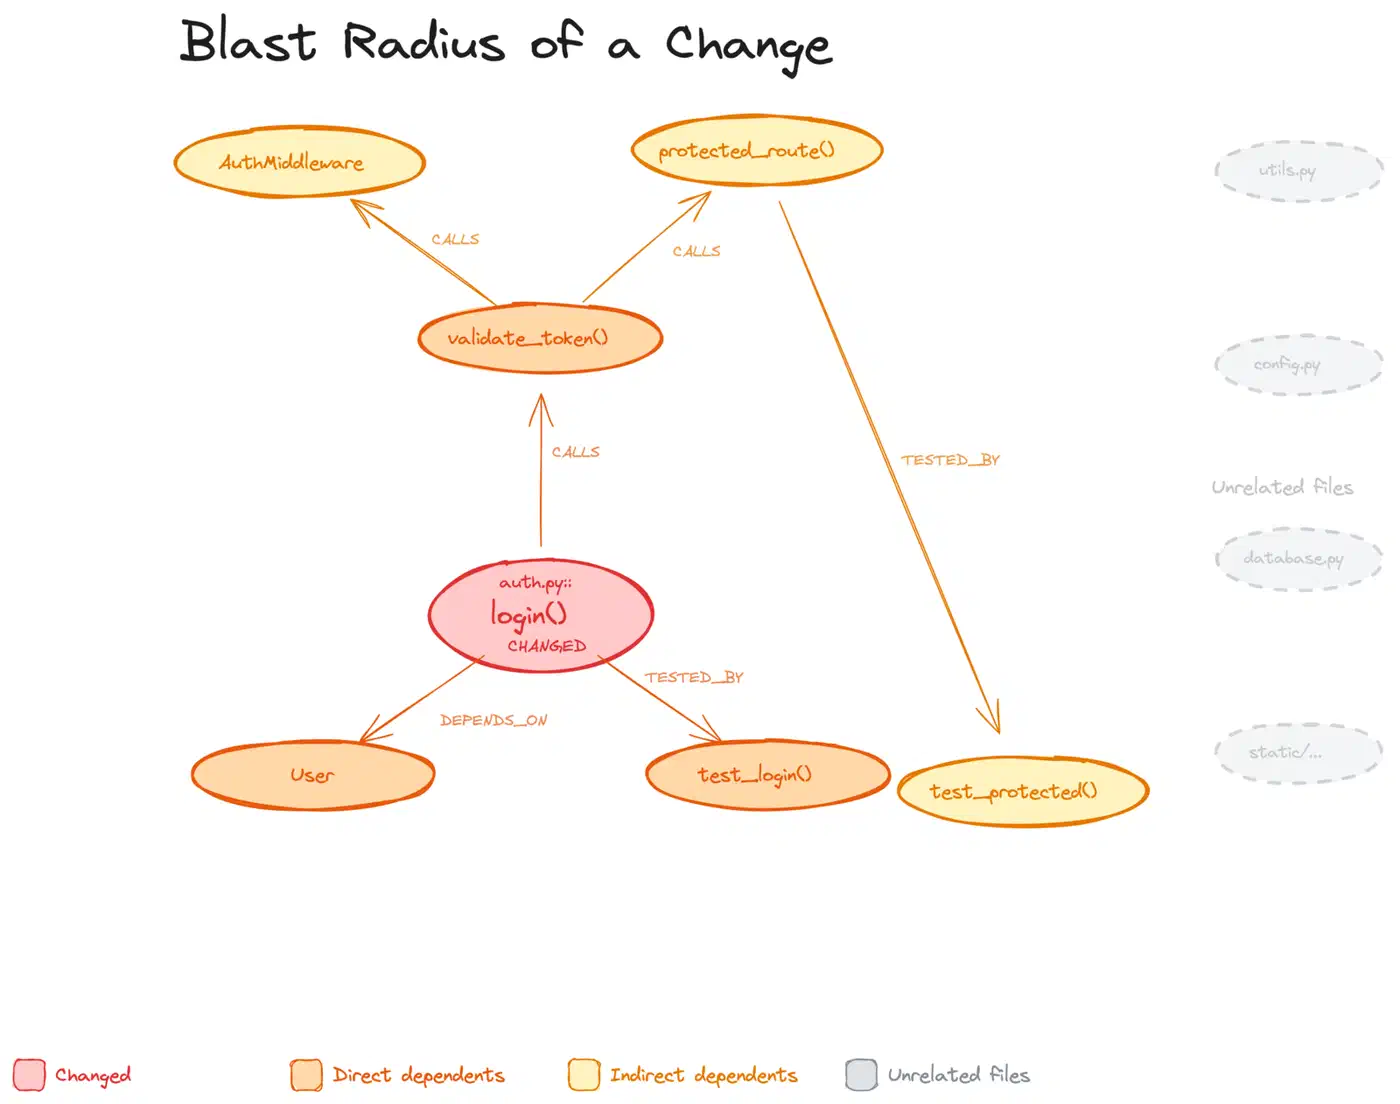
Blast radius is the query that pays for all of it. When a file changes, the graph traces the callers, dependents, and tests that could break. That set is the only thing your assistant reads.
The assistant reaches it over MCP , so it gets tools instead of a file dump. The same graph also answers from a CLI. The project is MIT licensed, written in Python, and ships on PyPI at v2.3.7.
What the code-review-graph MCP token reduction actually measures
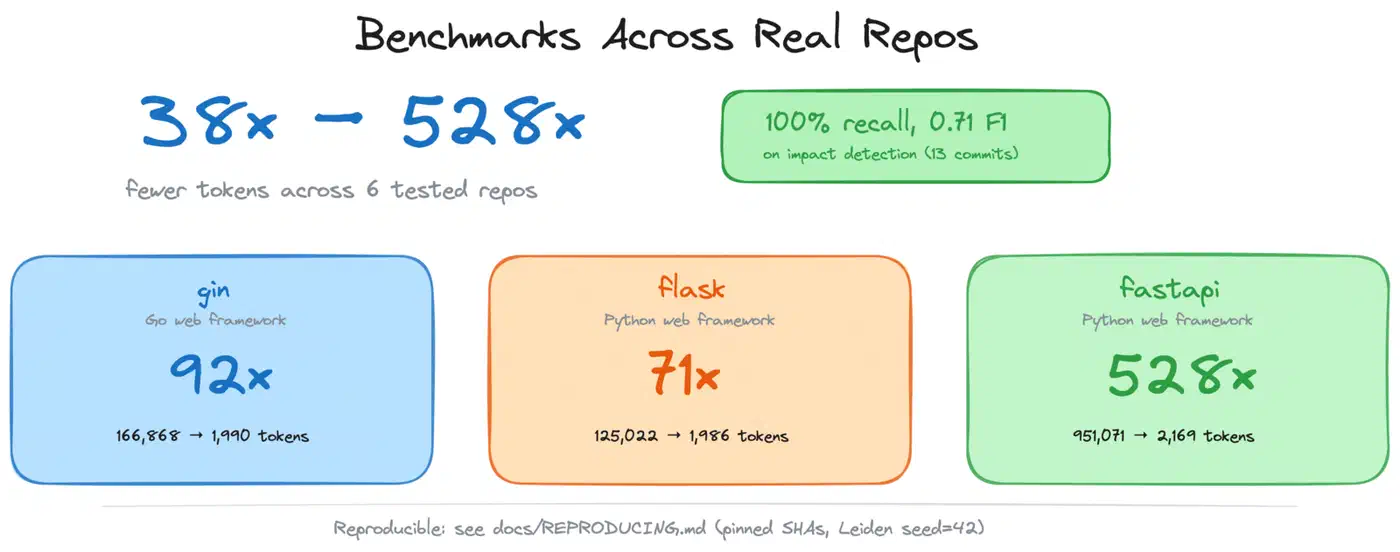
The benchmarks section reports a median per-question cut of about 82 times across six repositories. FastAPI, the largest corpus in the set, produces the 528 figure, and the project labels that row the maximum.
| Repo | Corpus tokens | Avg graph tokens | Reduction |
|---|---|---|---|
| FastAPI | 951,071 | 2,169 | 528.4x |
| code-review-graph | 208,821 | 2,495 | 93.0x |
| Gin | 166,868 | 1,990 | 91.8x |
| Flask | 125,022 | 1,986 | 71.4x |
| Express | 135,955 | 3,465 | 40.6x |
| httpx | 89,492 | 2,438 | 38.0x |
The baseline behind those ratios is the whole corpus, every source file. The project calls that an upper bound no real agent pays, since a decent agent greps for names and opens the best few matches. So a second benchmark, agent_baseline, scores the graph against that grep-and-read habit.
There is also a number that goes the other way. The formal token_efficiency benchmark stacks the full review payload against just the changed files in one commit. On small commits it reports ratios below 1, because the review payload carries impact edges and code snippets a one-file diff does not.
You can also re-run all of it yourself. Every config pins an upstream commit. The community detector uses a fixed seed, and embeddings behave the same way on any CPU. The recipe and the numbers you should get live in docs/REPRODUCING.md .
Blast-radius analysis found every file in the ground truth across all 13 test commits. However, that ground truth comes from the same graph the predictor walks. So treat that 1.0 recall as a ceiling, since it is circular by design.
Average F1 across those commits is 0.714, with average precision 0.578. Over-flagging is on purpose: too many files beats a missed broken caller. A cleaner co-change mode also runs. It seeds the predictor with one changed file, then grades it against the other files the author touched in that commit. Those numbers are not published yet.
When the graph costs you tokens instead
In the project’s own discussion tracker, a user reported the opposite of the headline after running the same work twice.
The one with crg is consuming 831k tokens and without it consumned 269k tokens.
The maintainer traced it to three causes. Some tools and modes skipped the graph entirely, and small repos paid a structural overhead they never earned back. Early versions also gave you no per-call token receipt, so nobody could check either problem.
a measured 3.1x regression deserved a fast answer, and this thread shaped real changes that just landed.
The fixes landed in the tool itself. Review and impact replies now carry a small context_savings estimate, and a --verify flag checks that estimate against a real tokenizer. Calibration data puts it within about 1% of real token counts across 222 sample files.
The project also published a FAQ section on when not to use it . Skip the graph on repos under a few hundred files and on trivial single-file edits. It earns nothing on a one-off question about a repo you will never open again, since the return comes from reuse across many queries.
What it parses, and what happens when it does not
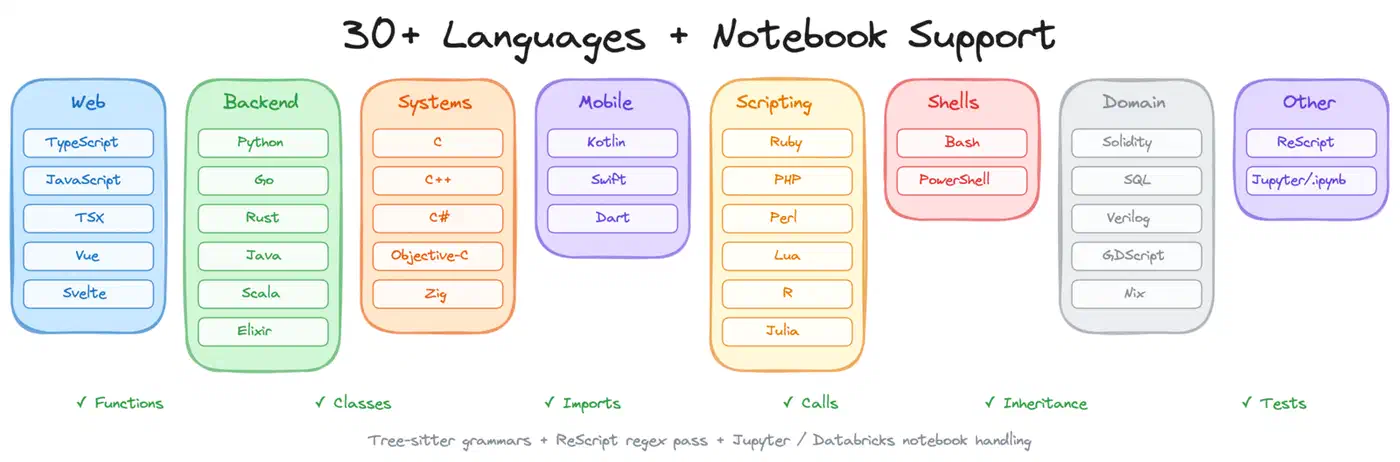
Coverage is unusually wide for a small project. Python, JavaScript, TypeScript and TSX, Go, Rust, Java, C, C++, C#, VB.NET, Ruby, Kotlin, Swift, PHP, Scala, Solidity, Dart, R, Perl, Lua, Objective-C, shell, Elixir, Zig, PowerShell, Julia, ReScript, GDScript, and Nix all parse.
It reaches past source files too. Verilog and SystemVerilog, SQL, Terraform structure, Ansible playbooks and roles, Vue and Svelte components, and Jupyter and Databricks notebooks are all covered. Astro files go through the TypeScript parser. Generic YAML is left alone on purpose, since treating config as source would flood the graph with noise.
PHP goes deeper still. It resolves Composer PSR-4 imports inside the repo, links Blade templates, and adds Laravel route and Eloquent edges. Those extra edges show up only when the source has real framework imports and model inheritance.
For anything it misses, drop a languages.toml into .code-review-graph/ and map your file extensions to any grammar in the bundled Tree-sitter language pack. Then name the node types for functions, classes, imports, and calls.
[languages.erlang]
extensions = [".erl"]
grammar = "erlang"
function_node_types = ["function_clause"]
class_node_types = ["record_decl"]
import_node_types = ["import_attribute"]
call_node_types = ["call"]
A generic walker takes it from there, with no fork and no code changes. The schema reference sits in docs/CUSTOM_LANGUAGES.md , and built-in languages can never be overridden, so a bad config file cannot break Python parsing. That config file is how a small project covers 30-odd languages without taking a pull request for each one.
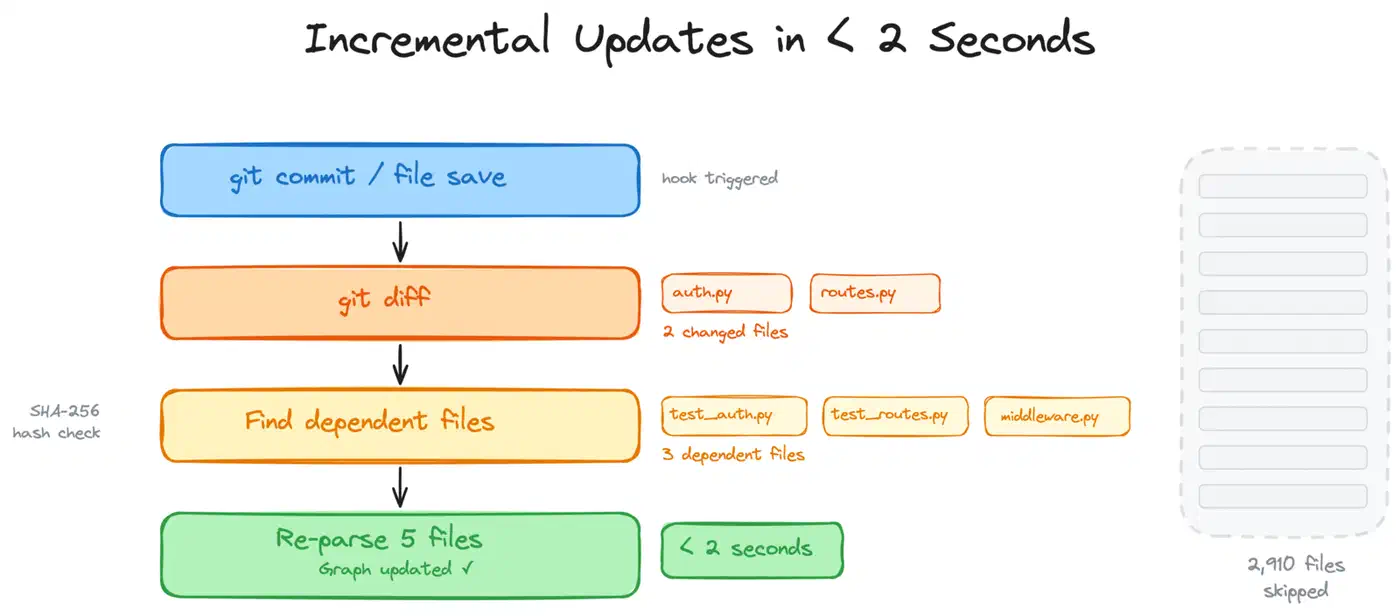
Between full builds, small updates keep the graph current. File saves and commit hooks trigger a diff. The tool finds dependents through content hashes and re-parses only what changed.
How to build a code graph and wire it into your AI coding tool
Check your Python version
Run python3 --version and confirm 3.10 or newer. Installing uv
first is optional, but it gives you the uvx path the generated MCP config prefers.
Install the package
Run pip install code-review-graph. Prefer pipx install code-review-graph if you want it kept out of your project environments.
Configure your tools
Run code-review-graph install. It finds the AI coding tools you have and writes the MCP config for each one. Where the tool supports it, the command also adds native hooks or skills plus graph-aware rules.
Or target one tool only
Run code-review-graph install --platform claude-code. Swap in codex, cursor, gemini-cli, kiro, copilot, copilot-cli, or codebuddy for the others.
Restart the editor or CLI
MCP configuration is read at startup. Skipping the restart is the most common reason the new tools never show up.
Build the graph
Run code-review-graph build, or just ask your assistant to build the code review graph for the project. Expect roughly ten seconds on a 500-file project.
Ask a question that used to be expensive
Ask what the blast radius of a change to one function is, or which tests cover it. The answer should come back from the graph, with no directory-wide read.
Keep it fresh
Turn on watch mode or the supported commit hooks so file saves trigger incremental updates. The project reports a 2,900-file project re-indexing in under two seconds.
Running it on every pull request without leaking code
The same analysis ships as a composite GitHub Action. On each pull request it posts one sticky comment with risk-scored functions, affected flows, and test gaps. Every new push updates that comment in place instead of piling up new ones.
The graph is built and queried entirely on your CI runner, with no source code sent to an outside service. Wiring it up takes a short workflow file, and you should pin the action version rather than track a branch.
# .github/workflows/code-review-graph.yml
on:
  pull_request:

permissions:
  contents: read
  pull-requests: write

jobs:
  review:
    runs-on: ubuntu-latest
    steps:
      - uses: actions/checkout@v7
      - uses: tirth8205/code-review-graph@v2.3.6
        with:
          github-token: ${{ secrets.GITHUB_TOKEN }}
An optional fail-on-risk input turns that advisory comment into a merge gate. The action’s inputs, risk levels, and caching are spelled out in docs/GITHUB_ACTION.md
. The project runs the same workflow on its own pull requests.
Because the tool writes into other tools’ config files, the uninstall path is careful. You get a dry-run mode that writes nothing and a prompt before it applies. It strips out only its own entries, and writes are atomic, so a failed one leaves your original file intact.
The tool has one hard limit: it makes your assistant read less, which improves your odds on a review but does not do the review for you.
So install it on a big repo where you already feel the cost. Measure with --verify before you trust the headline ratio. Leave fail-on-risk off until you have watched its false positives for a few weeks.