 Botmonster Tech
TradingView MCP lets Claude read and drive your charts

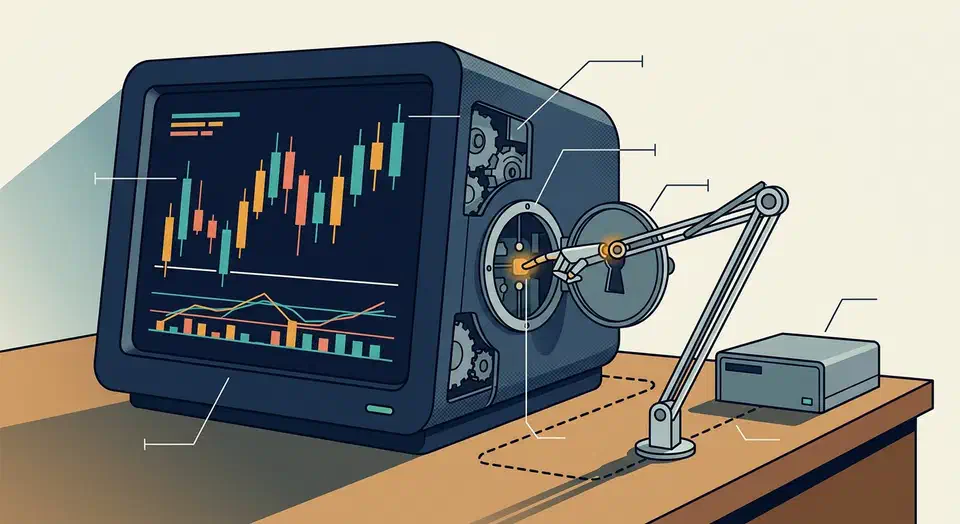
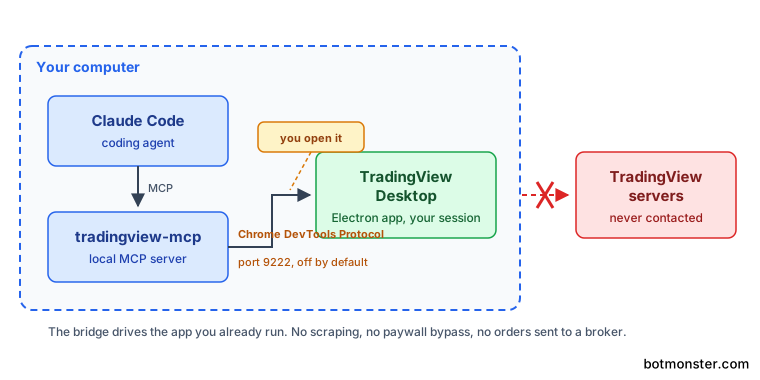
The TradingView MCP server never touches TradingView’s servers. It drives the TradingView Desktop app already running on your own machine. The channel is the Chrome DevTools Protocol, the same debug interface built into VS Code and Slack. That port is off by default, so you switch it on yourself with a command-line flag.
Key Takeaways
- The bridge talks to the app on your machine, never to TradingView’s servers.
- You switch on a debug port yourself, so nothing connects by accident.
- It needs your own paid TradingView account and bypasses no paywall.
- It reads and clicks charts, and it places no real trades.
- It leans on hidden internals, so a TradingView update can break it overnight.
What a TradingView MCP server actually connects to
A TradingView MCP server talks only to the TradingView Desktop application already running on your own computer, over a local port. The company’s own servers stay out of the loop.
The channel is the Chrome DevTools Protocol , the standard debugging interface Google built into every Chromium and Electron app. VS Code, Slack, and Discord all expose it, and so does TradingView Desktop, because it’s an Electron app underneath.
That port stays closed until you open it. The project README
is blunt about the requirement: you launch the desktop app with --remote-debugging-port=9222, and nothing works before you do.
The project also spells out what the bridge refuses to do. It never reaches TradingView’s servers, stores or redistributes market data, bypasses a paywall, or places a real trade. It also won’t run at all without a paid subscription and the installed desktop app.
TradingView’s Terms of Use restrict automated data collection and non-display usage. The project’s own disclaimer admits that driving the desktop app with a script may clash with those rules. Reading your own screen with a debugger is a long way from scraping a service, but the risk sits with you. The tool carries no affiliation with or endorsement from TradingView Inc.
What an agent can actually do with a chart
The bridge exposes 84 tools over the Model Context Protocol, plus a tv command-line equivalent for each one.
| Job | What the agent can do |
|---|---|
| Read | Symbol, timeframe, indicator values, price levels, labels, tables, and zones drawn by Pine indicators |
| Drive | Change symbol, timeframe, and chart style, add or remove indicators, build 2x2 or 3x1 grids |
| Write | Inject Pine Script, compile it, read the errors and the log output, save it |
| Draw | Trend lines, horizontal lines, rectangles, and text annotations |
| Practice | Step through historical bars in replay mode with simulated entries and exits |
| Never | Send a real order to a broker |
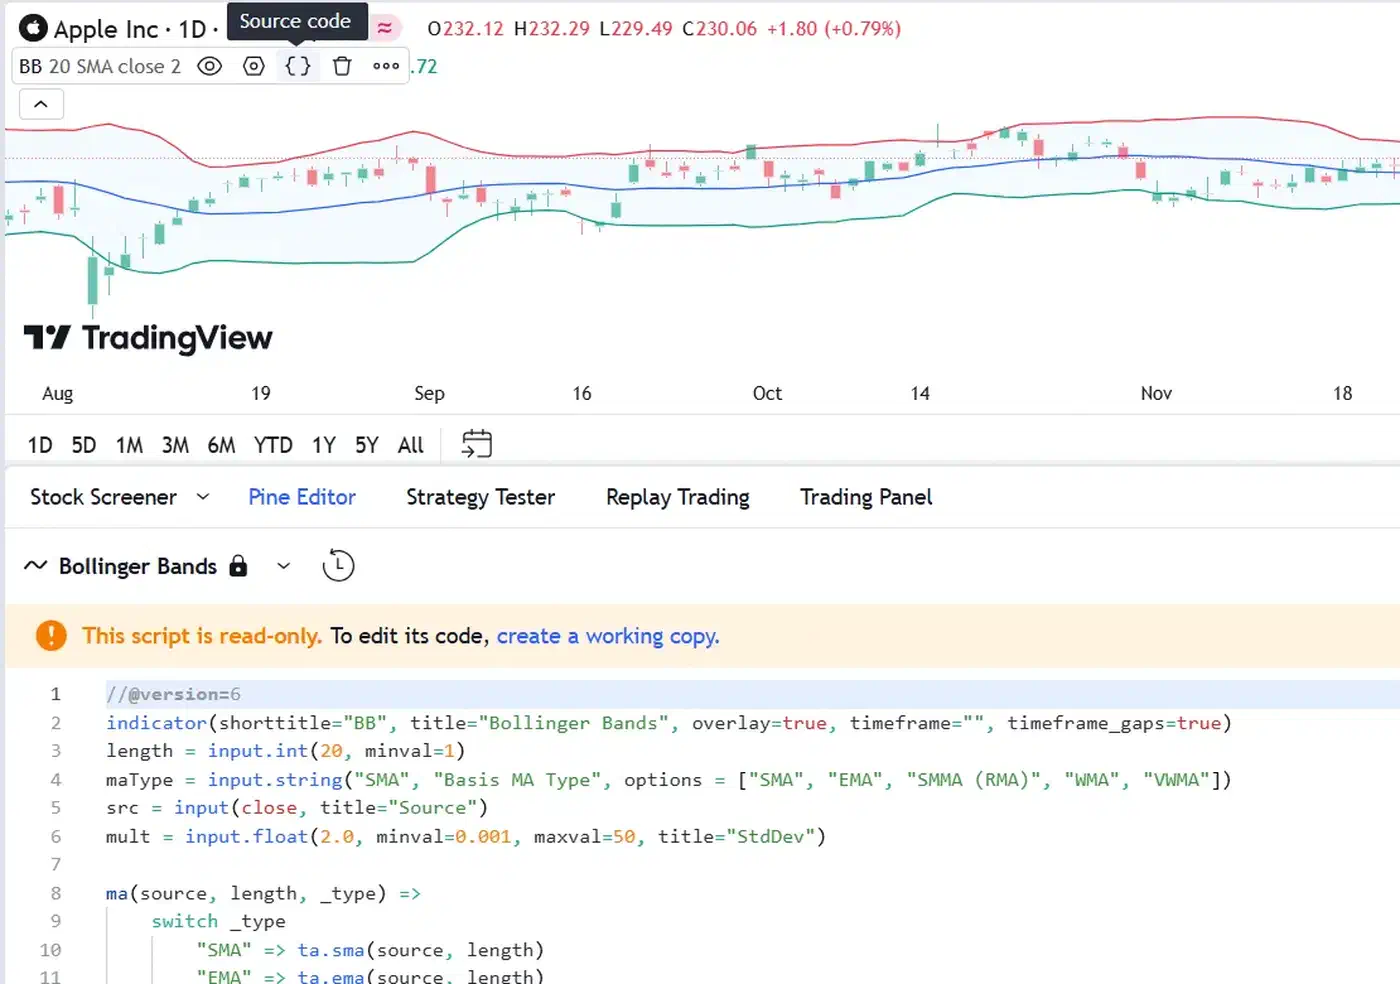
Reading Pine output is the sharpest trick here. Say a custom indicator paints session levels, bias labels, and a stats table. The bridge pulls those line.new(), label.new(), and table.new() values out as plain data, which beats squinting at them by hand.
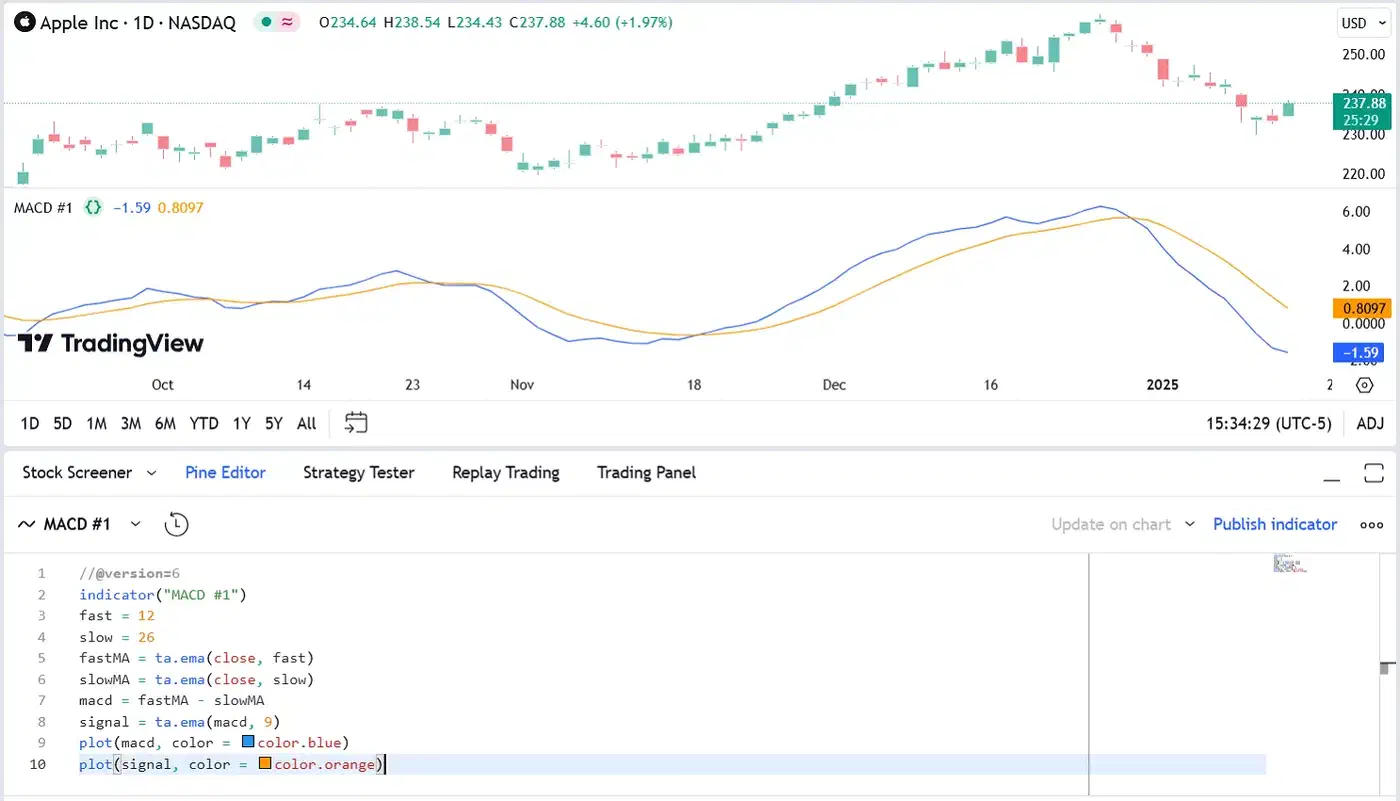
Pine Script development is where the author says the payoff is clearest. The research notes call the compile, error, fix loop the strongest use case. Pine has odd semantics that trip up experienced programmers. An agent that reads the compiler errors and proposes a fix saves real time.
A single Pine source file can run past 200KB, and 500 bars of price data is about 40KB. So every tool returns compact output by default. That drops a full “analyze my chart” workflow from roughly 80KB of context to 5-10KB.
The agent mostly reads chart state as data. It can grab a screenshot, but a human still has to read the shape of a price series.
How to connect Claude Code to TradingView Desktop
Setup takes a few minutes, and it all hinges on one command-line flag.
Confirm the prerequisites
You need TradingView Desktop installed, a valid subscription, Node.js 18 or newer, and a coding agent that speaks the Model Context Protocol . Claude Code is the reference setup.
Pin your TradingView version
The bridge reads undocumented internals. Stop TradingView from auto-updating before you build a workflow on it. Otherwise an overnight release can break your setup without warning.
Start TradingView with the debug port
Launch the desktop app with --remote-debugging-port=9222. The repository ships launch scripts for macOS, Windows, and Linux that find the binary for you.
Register the MCP server
Clone the repo, run npm install, then add the server to your agent’s MCP config. It has only two dependencies, the MCP SDK and chrome-remote-interface, so the install is quick.
Verify the connection
Ask the agent to run a health check. If it can’t reach the app, the debug flag didn’t take effect. Go back to the launch step; the config is not the problem.
Read before you act
Ask it to describe the current chart, the timeframe, and the visible indicators. Read the answer against your own screen before you let the agent change anything.
Move on to Pine Script
Ask it to read an indicator’s output and suggest a change. This is the workflow with the least ambiguity and the most obvious payoff.
Turn the debug port off when you finish
An open port 9222 is a live control surface for the application. Close it once you stop using the bridge.
The failure modes to expect
The bridge reads internal TradingView APIs that nobody documents and nobody promises to keep stable. Any desktop update can break any tool, with no notice.
Streaming data changes faster than an agent can respond, which leaves the reasoning stale by the time it lands. The research notes recommend piping streams to human dashboards rather than feeding them to the agent.
Financial interfaces are dense and labelled inconsistently. An agent misreading an indicator table looks exactly like an agent reading it correctly. Fusion Markets raises the same worry in its guide to connecting Claude and TradingView.
Claude can be confident and wrong. If an analysis confirms your existing view, it does not mean you should act without further scrutiny.
Port 9222 also hands anything on your machine a control surface into the app. The project’s security policy tells you to keep that port on localhost and never expose it to your network. It also warns you to check stream output before you pipe it to any outside service.
Who this is for, and who should not bother
This fits someone who already pays for TradingView, already runs a coding agent, and spends real hours writing Pine Script. It also fits anyone curious about how agents handle stateful desktop applications, since that part transfers to any other Electron app.
Skip it if you want automated trading. The tool places no orders and says so in five separate places. Skip it too if you won’t pin an app version and debug a broken setup after the update that eventually breaks it.
The repository has pulled in about 5,400 stars and 2,400 forks, which is a lot of attention for a niche tool. Some of those numbers don’t match what the files say.
| What you might read | What the files actually say |
|---|---|
| GitHub lists the licence as “Other” | The LICENSE file is plain MIT, plus a trademark notice covering TradingView and Anthropic |
| The API reports 169 open issues | Only 37 are real issues; the other 132 are open pull requests |
| The tool reference heading counts 78 tools | The architecture section and the research notes both say 84 |
| “29 tests” sounds like broad coverage | They cover Pine analysis, compile checks, and CLI routing, not chart control |
None of that is a deal breaker. The licence is genuinely open, and a fork queue that size signals interest. The docs drift faster than the code, which is fair warning for a project the author openly calls a research experiment.
Treat it as a Pine Script assistant that can also see your chart, and it earns its keep. Build infrastructure on it and the next TradingView release can take the whole thing down.