Build a CLI Dashboard with Go and Bubble Tea

The Charmbracelet Bubble Tea framework lets you build live terminal dashboards in Go using the Model-Update-View pattern from Elm. Pair it with Lip Gloss for styling and Bubbles for ready-made widgets. You get live panels, key navigation, and flex layouts. It all ships as one binary with zero runtime dependencies.
Terminal dashboards fill a niche that classic CLIs and web apps both miss. Think of a monitor that runs over SSH on a headless box. Think of a database explorer that starts in milliseconds with no browser. Think of a log viewer your ops team can reach with no auth layer to set up. These are the use cases where TUI dashboards shine. Bubble Tea now sits at v2 with over 41,000 GitHub stars and more than 18,000 apps built on it. It has become the go-to framework for this kind of work in Go.
Why a TUI Dashboard Instead of a Web Dashboard
The case for terminal dashboards comes down to setting and access. If your team already lives in the terminal, a fresh browser tab for a monitor adds friction. A TUI dashboard starts at once and runs over SSH to remote servers. It needs no auth layer past what SSH already gives you. It uses far less memory than a browser app.
Consider the common use cases: system monitors for servers, Kubernetes pod viewers, database query tools, CI/CD pipeline watchers, and live log feeds. All of these gain from running right in the terminal where the operator already works.
Go is a natural fit here thanks to its build model. go build makes one static binary that runs on any matching OS and CPU pair with no outside deps. Cross-builds ship with the toolchain. Running GOOS=linux GOARCH=amd64 go build on a Mac gives you a Linux binary. Go’s goroutines also handle the live data feeds a dashboard needs without callback spaghetti.
Bubble Tea vs the Alternatives
For Go developers, the main rival to Bubble Tea is tview
. The two take different paths. tview uses a callback-heavy style: you build widgets, register event handlers, and mutate state in place. Bubble Tea follows The Elm Architecture, where all state changes flow through one Update function. This makes Bubble Tea apps easier to reason about as they grow. There is just one spot where state changes happen.
For Python developers eyeing Textual instead, the trade-off is mostly about language taste and shipping. Textual supports CSS styling and a similar component model. Still, Go’s one-binary output makes shipping simpler. You hand someone a file and they run it, with no virtualenv or interpreter version to fuss over. For a deep dive into the Python side, see our guide on building TUI apps with Textual and Rich .
| Feature | Bubble Tea (Go) | tview (Go) | Textual (Python) |
|---|---|---|---|
| Architecture | Elm/MVU pattern | Imperative/callbacks | MVU-inspired |
| Styling | Lip Gloss (CSS-like) | Built-in primitives | CSS files |
| Component library | Bubbles (separate pkg) | Built-in widgets | Built-in widgets |
| Distribution | Single binary | Single binary | pip/virtualenv |
| GitHub stars | 41k+ | 10.5k | 25k+ |
| SSH serving | Wish library | Manual | Not built-in |
If you also need classic arg parsing next to the TUI, with subcommands, flags, and shell completions, our post on building CLI tools with Cobra and Bubble Tea shows how to fuse both in one Go binary.
The Elm Architecture in Go
Every Bubble Tea app is built on three parts. A Model holds state. An Update function changes state in reply to messages. A View function turns state into a string. Grasp this cycle and you can build anything with Bubble Tea.
The Model is a Go struct with every piece of data your app needs to render. For a dashboard, that means panel sizes, which panel has focus, the data shown in each panel, cursor spots, and any short-lived UI state like whether a help overlay is open.
type model struct {
    width, height int
    activePanel   int
    cpuUsage      float64
    memUsage      float64
    logLines      []string
    err           error
}
The Init method returns a first command that runs once at startup. This is where you kick off your first data fetch or start a ticker:
func (m model) Init() tea.Cmd {
    return tea.Batch(
        fetchSystemMetrics,
        tickEvery(2 * time.Second),
    )
}
The Update method is the core of the design. It takes a message (a key press, a timer tick, data arriving from an HTTP call) and returns the new model plus an optional new command. All state changes happen here:
func (m model) Update(msg tea.Msg) (tea.Model, tea.Cmd) {
    switch msg := msg.(type) {
    case tea.KeyMsg:
        switch msg.String() {
        case "q", "ctrl+c":
            return m, tea.Quit
        case "tab":
            m.activePanel = (m.activePanel + 1) % 3
        }
    case metricsMsg:
        m.cpuUsage = msg.CPU
        m.memUsage = msg.Memory
        return m, tickEvery(2 * time.Second)
    case tea.WindowSizeMsg:
        m.width = msg.Width
        m.height = msg.Height
    }
    return m, nil
}
The View method is a pure function. It takes the current state and returns a string for the whole terminal screen. It does no I/O and changes nothing. Bubble Tea calls it after every Update to re-render the UI:
func (m model) View() string {
    header := headerStyle.Render("System Dashboard")
    cpu := fmt.Sprintf("CPU: %.1f%%", m.cpuUsage)
    mem := fmt.Sprintf("Memory: %.1f%%", m.memUsage)
    return lipgloss.JoinVertical(lipgloss.Left, header, cpu, mem)
}
The message loop ties it all together. Bubble Tea listens for events, calls Update with each event as a message, then calls View to render the result. Commands returned from Update run in goroutines, and their return values become new messages fed back into Update. This one-way data flow means you can trace any bug by checking what message arrived and how Update dealt with it.

Building the Dashboard Layout
A dashboard needs many panels in a grid: a header bar, sidebar, main pane, and status bar. Lip Gloss handles the styling and layout.
Lip Gloss works like CSS for the terminal. You set up styles with chained methods and apply them to strings:
var panelStyle = lipgloss.NewStyle().
    Border(lipgloss.RoundedBorder()).
    BorderForeground(lipgloss.Color("62")).
    Padding(1, 2).
    Width(40)

var headerStyle = lipgloss.NewStyle().
    Bold(true).
    Foreground(lipgloss.Color("229")).
    Background(lipgloss.Color("57")).
    Padding(0, 1).
    Width(80)
Panel layout uses JoinHorizontal and JoinVertical to arrange styled blocks:
func (m model) View() string {
    sidebar := panelStyle.Width(m.width / 4).Render(m.sidebarContent())
    main := panelStyle.Width(m.width * 3 / 4).Render(m.mainContent())
    body := lipgloss.JoinHorizontal(lipgloss.Top, sidebar, main)

    header := headerStyle.Width(m.width).Render("Dashboard")
    status := statusStyle.Width(m.width).Render(m.statusLine())

    return lipgloss.JoinVertical(lipgloss.Left, header, body, status)
}
Flex sizing reacts to terminal resizes through tea.WindowSizeMsg. When the terminal window changes size, Bubble Tea sends this message. Your Update function stores the new width and height. Your View function then sizes panels by ratio:
case tea.WindowSizeMsg:
    m.width = msg.Width
    m.height = msg.Height
    m.sidebarWidth = msg.Width / 4
    m.mainWidth = msg.Width - m.sidebarWidth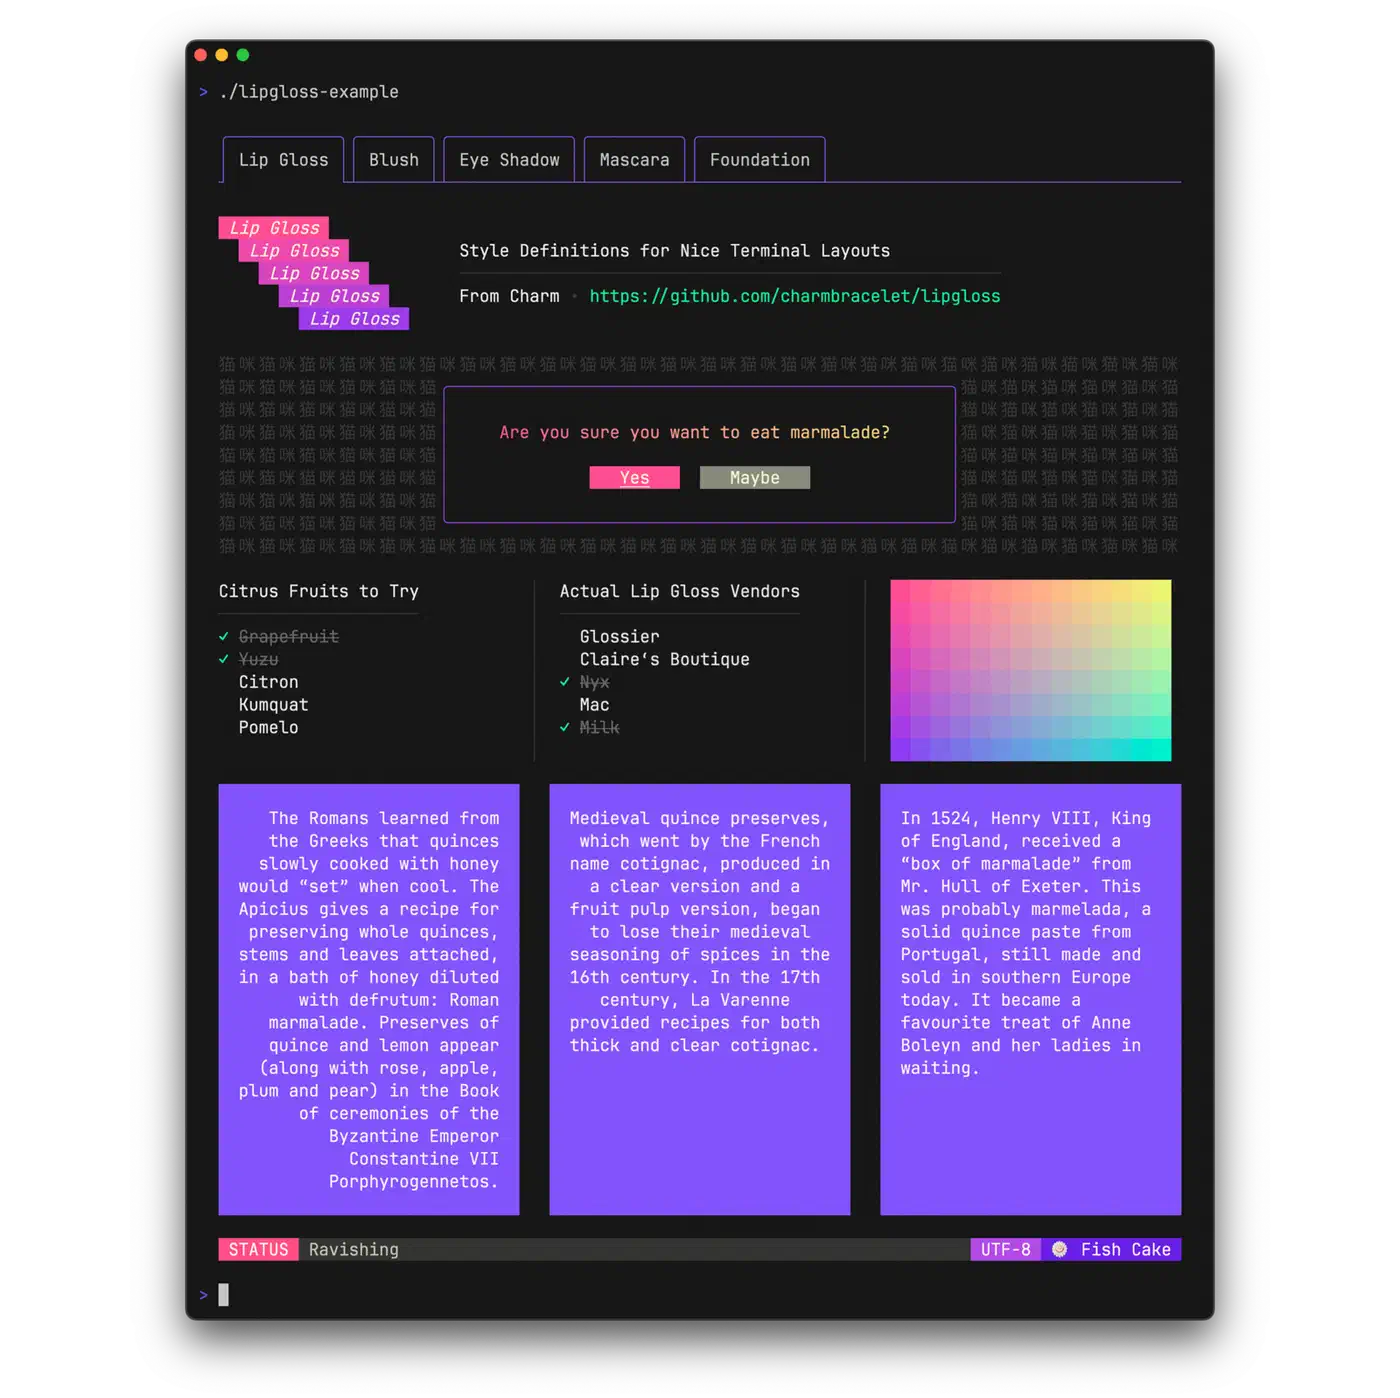
For color themes, set up a palette struct and use it across your styles. This makes it easy to ship many themes or adapt to terminal limits:
type theme struct {
    Primary   lipgloss.Color
    Secondary lipgloss.Color
    Accent    lipgloss.Color
    Error     lipgloss.Color
}

var defaultTheme = theme{
    Primary:   lipgloss.Color("62"),
    Secondary: lipgloss.Color("241"),
    Accent:    lipgloss.Color("229"),
    Error:     lipgloss.Color("196"),
}
Adding Real-Time Data with Commands and Ticks
A dashboard without live data is just a static screen. Bubble Tea’s command system handles async data fetching without blocking the UI.
The tea.Tick function makes a command that sends a message after a given delay. Use it to set up regular data refreshes:
type tickMsg time.Time

func tickEvery(d time.Duration) tea.Cmd {
    return tea.Tick(d, func(t time.Time) tea.Msg {
        return tickMsg(t)
    })
}
When the tick message arrives in Update, fetch new data and schedule the next tick:
case tickMsg:
    return m, tea.Batch(
        fetchSystemMetrics,
        fetchLogTail,
        tickEvery(2 * time.Second),
    )
Commands run in goroutines. The UI stays snappy while network calls or file reads run in the background. A command that fetches system metrics with gopsutil looks like this:
func fetchSystemMetrics() tea.Msg {
    cpuPercent, _ := cpu.Percent(0, false)
    vmStat, _ := mem.VirtualMemory()
    diskStat, _ := disk.Usage("/")
    return metricsMsg{
        CPU:    cpuPercent[0],
        Memory: vmStat.UsedPercent,
        Disk:   diskStat.UsedPercent,
    }
}
For HTTP data sources, the shape is the same. The command makes the request and returns the result as a message:
func fetchAPIData() tea.Msg {
    resp, err := http.Get("https://api.example.com/status")
    if err != nil {
        return errMsg{err}
    }
    defer resp.Body.Close()
    var data StatusResponse
    json.NewDecoder(resp.Body).Decode(&data)
    return apiDataMsg{data}
}
Error handling uses the same message pattern. Commands return error messages. The Update function decides how to show them: a status bar note, a retry timer, or both:
case errMsg:
    m.err = msg.err
    m.statusText = fmt.Sprintf("Error: %s", msg.err)
    return m, tickEvery(5 * time.Second) // retry after delay
tea.Batch lets you run many commands at once. When a tick fires, you might want to fetch metrics, check API status, and tail a log file all at the same time.
Interactive Features: Navigation, Selection, and Input
A dashboard needs keys for moving between panels, scrolling through data, filtering results, and firing actions.
Key handling happens in Update by matching on tea.KeyMsg:
case tea.KeyMsg:
    switch msg.String() {
    case "tab":
        m.activePanel = (m.activePanel + 1) % panelCount
    case "shift+tab":
        m.activePanel = (m.activePanel - 1 + panelCount) % panelCount
    case "j", "down":
        m.panels[m.activePanel].CursorDown()
    case "k", "up":
        m.panels[m.activePanel].CursorUp()
    case "/":
        m.filterMode = true
    case "?":
        m.showHelp = !m.showHelp
    }
Focus tracking notes which panel is active and routes key events only to that panel. The active panel gets a bright border, and the rest get a dim style:
func (m model) panelBorder(index int) lipgloss.Style {
    if index == m.activePanel {
        return panelStyle.BorderForeground(defaultTheme.Accent)
    }
    return panelStyle.BorderForeground(defaultTheme.Secondary)
}
The Bubbles library gives you ready-made widgets. The list.Model gives you a scrollable, filterable list with key nav baked in. The table.Model shows data in columns with sortable headers. The textinput.Model gives you a text field for search and filter. Drop them into your model and pass through their Update and View calls. This filterable-list pattern is the same one behind an interactive Gitea repo picker
, where you type to narrow the list and hit enter to clone.
import "github.com/charmbracelet/bubbles/list"
import "github.com/charmbracelet/bubbles/table"

type model struct {
    processList list.Model
    metricsTable table.Model
    filterInput textinput.Model
    // ...
}
The help.Model widget from Bubbles builds a tidy help overlay from your key bindings. Users press ? to see what keys are open, and you skip the chore of keeping a help screen by hand.
Packaging and Distribution
Go’s build model pays off at ship time. go build -o dashboard . makes one binary you copy to a server, mark as runnable, and start. Nothing else to install.
Cross-builds take one env var change:
# Linux AMD64 (most servers)
GOOS=linux GOARCH=amd64 go build -o dashboard-linux-amd64

# macOS Apple Silicon
GOOS=darwin GOARCH=arm64 go build -o dashboard-darwin-arm64

# Windows
GOOS=windows GOARCH=amd64 go build -o dashboard-windows.exe
GoReleaser
automates multi-platform builds and GitHub Releases. A .goreleaser.yml config builds every target, makes archives, writes checksums, and ships releases. It can also build a Homebrew formula. macOS and Linux users then install your dashboard with brew install yourtap/dashboard.
For teams that want SSH-reachable dashboards, Charmbracelet’s Wish
library serves Bubble Tea apps over SSH. Users connect with ssh dashboard.yourserver.com and get the full TUI with no local install. Every team member with SSH access gets the dashboard for free.
Docker shipping works too for teams that like containers. A multi-stage Dockerfile keeps the image tiny:
FROM golang:1.22 AS builder
WORKDIR /app
COPY . .
RUN CGO_ENABLED=0 go build -o dashboard .

FROM scratch
COPY --from=builder /app/dashboard /dashboard
ENTRYPOINT ["/dashboard"]
For config, env vars work well for simple setups like data source URLs and refresh delays. A TOML or YAML config file is better for rich themes and multi-source setups. The Viper library handles both styles and supports live config reloads. That helps you change refresh delays or swap data sources without a restart.
Getting Started
The fastest path to a working dashboard is to start with the skeleton below and grow it one panel at a time:
- Initialize a Go module:
go mod init dashboard - Install the core packages:
go get charm.land/bubbletea/v2 charm.land/lipgloss/v2 github.com/charmbracelet/bubbles - Build a minimal Model/Update/View with a single panel showing static data
- Add
tea.Tickto refresh data periodically - Split the layout into multiple panels with Lip Gloss
- Drop in Bubbles components (list, table, text input) for interactivity
- Add focus management and keyboard shortcuts
Each step makes a working app you can test with go run . and see in your terminal right away. The Elm Architecture is additive by design. New features mean new message types and new cases in Update, not a rewrite of old code. If you would rather scaffold the boilerplate than type it, the agents that write code from a prompt
handle the repetitive Model and Update wiring well, leaving you to design the layout.
The Charmbracelet ecosystem also has Huh
for forms and wizards in TUI apps, plus Harmonica
for smooth motion. Both use the same message-passing style, so adding them means a few more case branches in your Update function.