eBPF tracing for Linux 5.15: real-time kernel monitoring

eBPF (extended Berkeley Packet Filter) lets you attach tiny sandboxed programs to kernel events: syscalls, network packets, scheduler decisions, and filesystem calls. You collect detailed performance data in real time. No kernel source changes, no custom modules, no service restarts. With bpftrace one-liners and the BCC toolkit, you can measure per-process disk latency, trace TCP connections, profile CPU hotspots, and find memory leaks on production Linux. Overhead is usually under 2%.
Everything here targets Linux 5.15+ kernels, with notes on newer features available in 6.x and later.
What eBPF Is and Why It Replaced Traditional Tracing
eBPF programs are bytecode. You load them into the kernel through the bpf() syscall. The kernel JIT-compiles them to native code and runs them inside a sandboxed VM. Before any program runs, the kernel’s verifier checks it: bounded loops only, safe memory access, no null pointer reads, no infinite paths. If the verifier rejects your program, it never loads. That’s what makes eBPF safe for production. A bad program can’t crash or hang your kernel.
Attach Points
eBPF programs hook into specific kernel events through different program types:
| Attach Point | What It Traces | Use Case |
|---|---|---|
| kprobes | Any kernel function entry/exit | Tracing internal kernel behavior |
| tracepoints | Stable kernel events | Syscall monitoring, scheduler events |
| uprobes | Userspace function entry/exit | Application-level tracing (OpenSSL, gRPC) |
| XDP | Network packets at driver level | Packet filtering, DDoS mitigation |
| perf events | CPU PMU counters | Hardware performance counters |
| cgroup hooks | Per-cgroup resource events | Container-aware monitoring |
| LSM hooks | Linux Security Module events | Security policy enforcement |
eBPF Maps
Maps are the shared data structures that make eBPF useful for monitoring. They let eBPF programs aggregate data inside the kernel and ship summaries to userspace, not raw events. Map types include hash maps, arrays, ring buffers, per-CPU arrays, and LRU hashes. This in-kernel rollup is why eBPF overhead stays low. You ship a count or a histogram to userspace, not millions of single events.
Why Older Tools Lost
SystemTap needs a compile step and kernel debug symbols at runtime. It turns scripts into C kernel modules, builds them with gcc, and loads the result. It works, but the build adds startup lag. The debug symbol need also makes deploys harder. Worse, a bug in your script can panic the kernel. A 2025 ACM study comparing eBPF and SystemTap overhead found that data transfer mechanisms hit SystemTap hard while eBPF stays mostly flat.
ftrace is strong and built into the kernel. But its raw interface is files in /sys/kernel/debug/tracing/. It works, but it’s clunky for anything past basic function tracing.
Custom kernel modules give you full power and zero safety. One wrong pointer read and you’ve got a kernel panic in production.
eBPF mixes the power of kernel modules, the safety of a sandboxed VM, and easy high-level tracing languages. That mix is why it’s now the standard for Linux observability.
Kernel Requirements
eBPF is solid on Linux 5.15+ and keeps gaining features in 6.x kernels. Check what your kernel supports with:
bpftool feature probeThis lists program types, map types, and helper functions you can use. For the ring buffer map type, you need kernel 5.8 or later. Ring buffers beat perf buffers for lower overhead and event ordering.
Getting Started with bpftrace - One-Liner Performance Tracing
bpftrace is the fastest way to get useful eBPF traces. Its awk-like syntax lets you write one-liner traces that answer specific performance questions in seconds. The current stable is v0.25.x and ships in most recent distro repos.
Installation
# Debian 13+ / Ubuntu 24.04+
sudo apt install bpftrace

# Fedora 41+
sudo dnf install bpftrace

# Verify
bpftrace --version
bpftrace needs root, or the CAP_BPF and CAP_PERFMON capabilities.
Trace New Processes
See every process exec in real time. It’s the fast way to debug surprise spawns from cron jobs, systemd timers, or hacked services:
bpftrace -e 'tracepoint:syscalls:sys_enter_execve {
  printf("%s %s\n", comm, str(args.filename));
}'
Histogram of Read Syscall Latency
This one-liner shows fast whether I/O is your bottleneck. It builds a latency histogram of read() syscalls in microseconds:
bpftrace -e '
tracepoint:syscalls:sys_enter_read { @start[tid] = nsecs; }
tracepoint:syscalls:sys_exit_read /@start[tid]/ {
  @usecs = hist((nsecs - @start[tid]) / 1000);
  delete(@start[tid]);
}'
Trace TCP Connections
Find out which processes are making outbound connections and where they’re going:
bpftrace -e 'kprobe:tcp_connect {
  printf("%s -> %s\n", comm,
    ntop(((struct sock *)arg0)->__sk_common.skc_daddr));
}'
Profile CPU Stack Traces
Sample kernel stacks at 99 Hz. We pick 99 Hz, not 100 Hz, to dodge aliasing with timer interrupts. Then print a frequency-sorted list of hot code paths:
bpftrace -e 'profile:hz:99 { @[kstack] = count(); }'Run this for 10 to 30 seconds, hit Ctrl+C, and you get a ranked list of where your kernel spends its time.
Syntax Reference
The core bpftrace parts fit into four groups. Probes define where to attach: kprobe, kretprobe, tracepoint, uprobe, uretprobe, profile, and interval. Builtins give you context at the probe site: comm (process name), pid, tid, nsecs (nanosecond timestamp), and arg0 through argN. Map functions roll up data: count(), hist(), lhist(), sum(), avg(), min(), max(). Finally, printf() handles structured output while print() dumps entire maps.
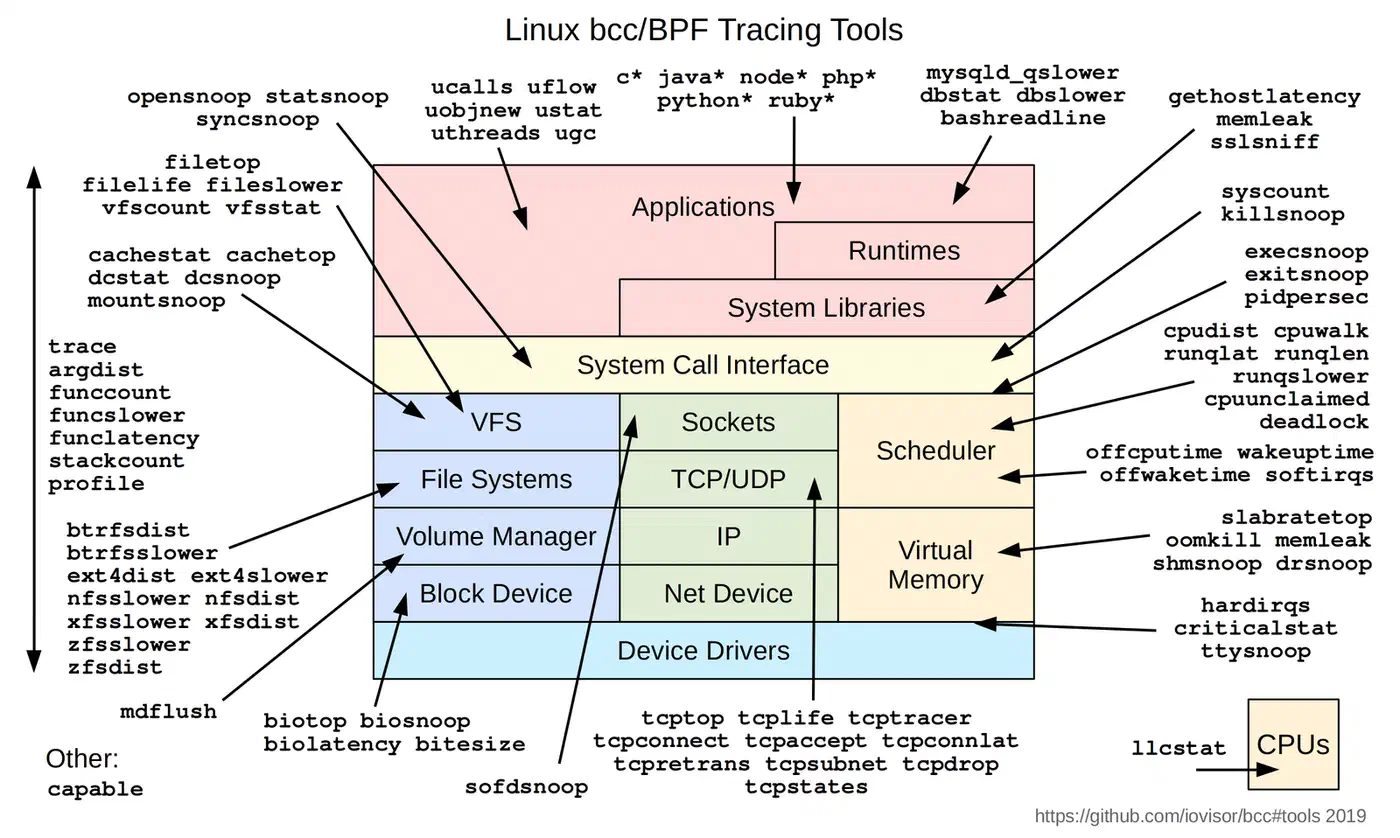
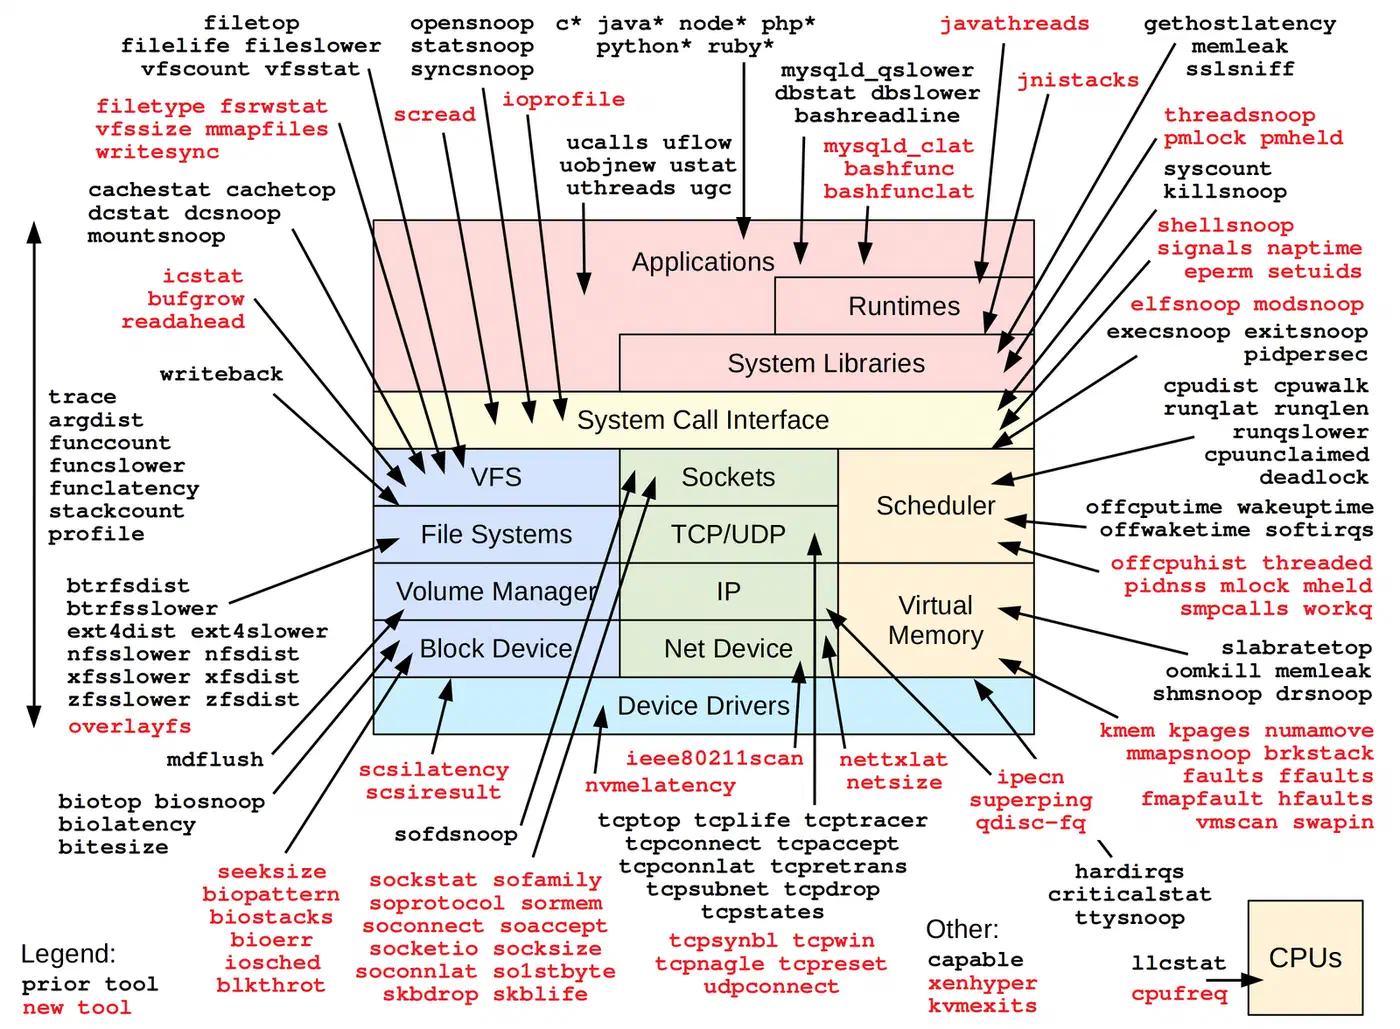
The BCC Toolkit - Pre-Built Scripts for Common Performance Questions
bpftrace is great for ad-hoc digging. But the BCC (BPF Compiler Collection) toolkit ships dozens of production-ready scripts that cover the most common monitoring tasks. These tools are written, tested, and documented. You can use them without writing any eBPF code.
Installation
# Debian / Ubuntu
sudo apt install bpfcc-tools

# Fedora
sudo dnf install bcc-tools
Tools install to /usr/share/bcc/tools/. On some distros they’re standalone commands with a -bpfcc suffix.
Essential BCC Tools
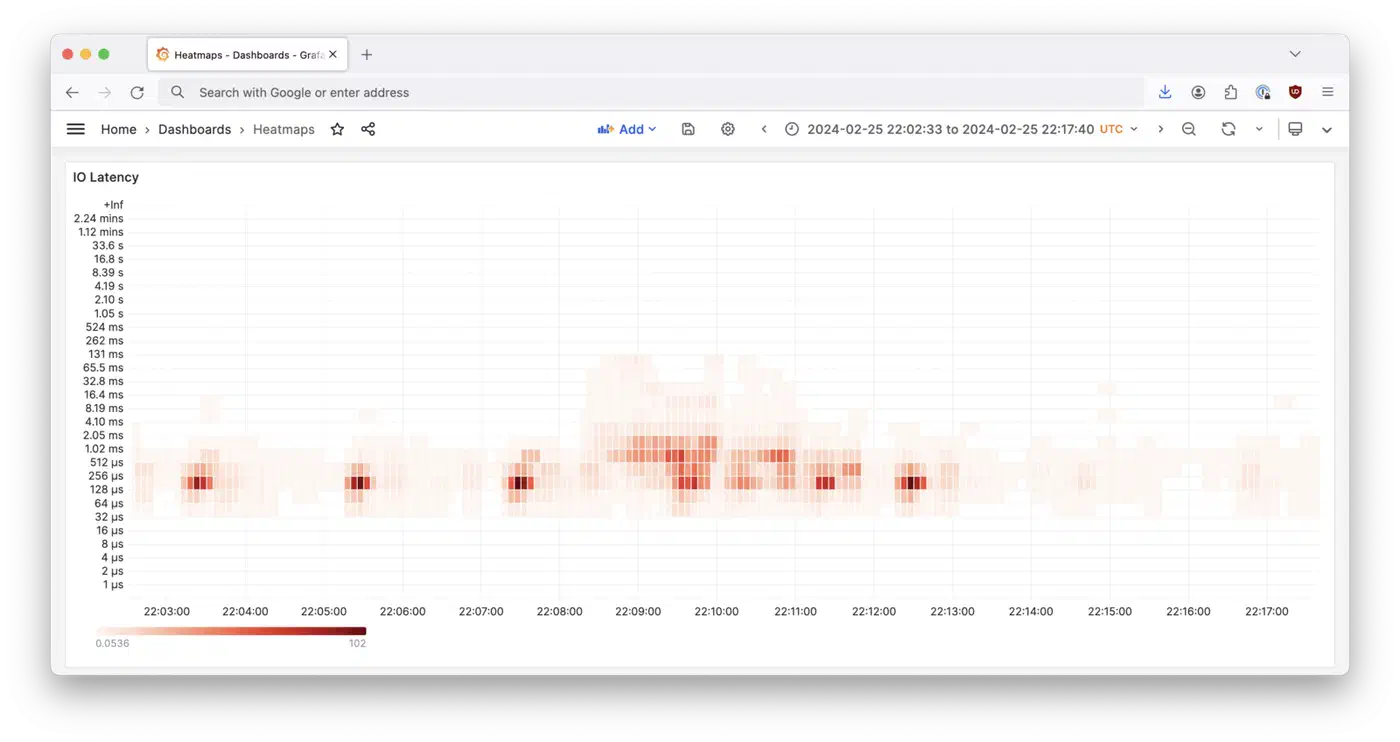
biolatency makes block I/O latency histograms. Run biolatency -D 5 to see per-disk latency in 5-second slots. If one of your drives is no longer hitting its rated benchmark figures
and has started throwing 10ms+ latencies, this is the fastest way to confirm it.
     usecs               : count    distribution
         0 -> 1          : 0        |                                        |
         2 -> 3          : 0        |                                        |
         4 -> 7          : 5        |*                                       |
         8 -> 15         : 42       |*********                               |
        16 -> 31         : 183      |****************************************|
        32 -> 63         : 112      |************************                |
        64 -> 127        : 29       |******                                  |
       128 -> 255        : 7        |*                                       |
tcplife traces the full TCP connection lifecycle. It logs source and destination, PID, duration, and bytes for every session. Start here if you’re hunting connection leaks, or wondering why your service keeps making thousands of short-lived connections.
execsnoop captures every execve() with the full command line, PID, and return code. Want to know what’s actually running on your box? This shows every process spawn, including the cron jobs and systemd oneshots you forgot about. For slow boot times caused by bad systemd units, walking the full boot timeline helps spot blocking services.
opensnoop traces every open()/openat() syscall with path, flags, PID, and error code. When a service fails with a cryptic error and you suspect a missing config file or a permission denial, opensnoop tells you exactly which file open failed and why.
funccount and funclatency measure any kernel or userspace function. funccount 'vfs_*' counts all VFS calls. funclatency vfs_read shows a latency histogram for reads. When you know something is slow but not which layer, these two tools narrow it down fast.
Building Custom eBPF Monitoring with Python and libbpf
When the pre-built tools don’t fit your case, you can write custom eBPF programs. There are two main paths. The BCC Python API is great for quick prototypes. The modern libbpf/CO-RE path is for portable, production-grade tools.
BCC Python Approach
Write your eBPF C program as a string. Then compile and load it with BCC’s Python bindings, and read the results from maps. Here’s a custom per-process syscall counter that prints the top syscall-heavy processes every 5 seconds:
from bcc import BPF
from time import sleep

bpf_program = """
#include <uapi/linux/ptrace.h>

BPF_HASH(syscall_count, u32);

TRACEPOINT_PROBE(raw_syscalls, sys_enter) {
    u32 pid = bpf_get_current_pid_tgid() >> 32;
    syscall_count.increment(pid);
    return 0;
}
"""

b = BPF(text=bpf_program)

while True:
    sleep(5)
    print("\n%-8s %-6s" % ("COMM", "COUNT"))
    counts = b["syscall_count"]
    for k, v in sorted(counts.items(),
                       key=lambda x: x[1].value,
                       reverse=True)[:10]:
        try:
            comm = open(f"/proc/{k.value}/comm").read().strip()
        except:
            comm = f"pid={k.value}"
        print("%-8s %-6d" % (comm, v.value))
    counts.clear()
BCC builds the eBPF C code at runtime with LLVM/Clang. That means a few seconds of startup cost and a need for a compiler toolchain on the target box. For quick digs this is fine. For long-running daemons, use libbpf.
libbpf/CO-RE Approach
CO-RE (Compile Once, Run Everywhere) is the modern way to write eBPF programs. You compile your eBPF C code once with clang -target bpf. The resulting object file embeds BTF (BPF Type Format) relocations. libbpf uses these relocations to adjust struct field offsets at load time. So the same compiled program runs on different kernel versions, no rebuild needed.
The workflow:
- Write your eBPF program in C (e.g.,
my_prog.bpf.c) - Compile:
clang -target bpf -O2 -g -c my_prog.bpf.c -o my_prog.bpf.o - Generate a skeleton header:
bpftool gen skeleton my_prog.bpf.o > my_prog.skel.h - Write a userspace
main.cthat uses the skeleton to open, load, attach, and read data - Compile the userspace program against libbpf
The skeleton header gives you type-safe access to maps and programs. No string lookups, no casting, and compile-time errors if your map names don’t match. Because the build is a single clang invocation, it slots cleanly into a Gitea Actions job running on Docker that compiles and ships the eBPF object on every commit.
Ring Buffer vs. Perf Buffer
For shipping events from kernel to userspace, prefer the BPF ring buffer (BPF_MAP_TYPE_RINGBUF) on kernel 5.8+. Ring buffers give you ordering guarantees, lower overhead, and shared memory across all CPUs. Perf buffers are per-CPU and can drop events under heavy load. In tests at scale, perf buffers have shown up to 50% throughput loss on 64-core systems. Ring buffers stay around 7% overhead.
When to Use Which
| Approach | Startup Time | Runtime Dependency | Best For |
|---|---|---|---|
| BCC Python | 2-5 seconds | LLVM/Clang, kernel headers | Quick investigations, prototyping |
| libbpf/CO-RE | Milliseconds | None (statically linked) | Production daemons, distributed tools |
Production Patterns - Dashboards, Overhead, and Safety
Running eBPF in production means knowing your overhead budget, safe deploy patterns, and how it fits your existing monitoring stack.
Overhead Guidelines
Not all probes are equal. Some hard numbers to plan around:
| Probe Type | Per-Event Overhead | Notes |
|---|---|---|
| kprobes on hot paths | 50-200 ns per call | e.g., tcp_sendmsg on a busy web server |
| Tracepoints | ~30 ns per event | Cheaper than kprobes, stable API |
| Profile probes at 99 Hz | <0.5% CPU | Sampling-based, minimal impact |
| uprobes | 1-5 us per call | Userspace transition is expensive |
Always benchmark before and after attaching probes. Use perf stat to measure the real CPU hit on your workload.
Integration with Prometheus and Grafana
Cloudflare’s ebpf_exporter
exposes eBPF map data as Prometheus metrics
. You define eBPF programs in YAML config files. Since the move from BCC to libbpf, the configs use pre-compiled .bpf.o objects. Prometheus then scrapes the exporter on a regular schedule.
The libbpf rewrite brought big gains. Startup is faster. Memory dropped from around 250 MiB to 30 MiB for complex configs like biolatency. And there’s no runtime need for LLVM. A prebuilt Docker image is on GitHub Container Registry.
Integration with OpenTelemetry
Grafana Beyla uses eBPF to auto-instrument apps for distributed tracing, no code changes needed. It hooks uprobes into Go, Python, Node.js, Java, and Rust runtime internals. It captures RED metrics (Rate, Error, Duration) and emits OpenTelemetry spans on its own. Beyla has been donated to the OpenTelemetry project as “OpenTelemetry eBPF Instrumentation.” Grafana keeps its own distribution too.
Other tools here include Pixie for Kubernetes-native auto-instrumented APM, Coroot for infrastructure monitoring, and Cilium’s Hubble for L3-L7 network visibility.
Container-Aware Tracing
On systems running containers, you often want to filter eBPF events to one workload. eBPF supports cgroup-based filtering since Linux 4.10. You can scope traces to a single container or a single Kubernetes pod. Each event can also carry cgroup ID, PID namespace, and container metadata for tight attribution.
Tetragon from Cilium adds Kubernetes-aware eBPF tracing. Its TracingPolicy resources filter events by namespace, pod label, or container right in the kernel. That cuts the volume of data shipped to userspace.
Safety and Debugging
eBPF programs are verified at load time, so they can’t crash the kernel. But they can slow down hot paths. Use these tools to manage what’s loaded:
# List all loaded eBPF programs
bpftool prog show

# Show detailed info about a specific program
bpftool prog dump xlated id <ID>

# Show JIT-compiled native code
bpftool prog dump jited id <ID>

# Printf-style debugging (writes to trace_pipe)
# In your eBPF C code: bpf_printk("value: %d", val);
cat /sys/kernel/debug/tracing/trace_pipe
On systems with Secure Boot and kernel lockdown on, loading eBPF programs needs CAP_BPF and CAP_PERFMON capabilities. Don’t run everything as root. Instead, use setcap on your tool binaries, or run via a service account that holds only those caps.
Common Troubleshooting
A few errors you’ll hit when getting started:
If you see “BTF is not available,” your kernel was built without CONFIG_DEBUG_INFO_BTF=y. CO-RE programs need BTF data. Check with ls /sys/kernel/btf/vmlinux. Most distro kernels since Ubuntu 20.10 and Fedora 33 include BTF.
Verifier rejections mean the verifier found something unsafe in your program. Common causes are unbounded loops, uninitialized registers, or direct memory access without bpf_probe_read_kernel(). Read the verifier log carefully. It tells you the exact instruction that failed and why.
“Operation not permitted” means you need root or the right caps. That’s CAP_BPF, CAP_PERFMON, and sometimes CAP_SYS_ADMIN for older kernels.
Seeing high overhead after attaching a probe? You probably put a kprobe on a function called millions of times per second. Filter events inside the eBPF program itself: check PID, return early for events you don’t care about. Or switch to tracepoints, which cost about 30 ns per event instead of 50-200 ns.
Further Reading
- Brendan Gregg’s BPF Performance Tools (Addison-Wesley, 2019). The go-to reference, with 150+ BPF tools and detailed use cases.
- The official kernel BPF documentation . Covers the verifier, program types, helper functions, and map types.
- The bpftrace reference guide . Full syntax and built-in docs.
- ebpf.io . The community site with an apps landscape, talks, and tutorials.
- The libbpf-bootstrap repo. Minimal examples for writing CO-RE eBPF programs from scratch.