Monitor Linux Servers: Prometheus and Grafana

Deploy Prometheus to scrape metrics from node_exporter on each Linux server. Then chart it all in Grafana with CPU, memory, disk, network, and systemd service health. The full stack (Prometheus 3.x, node_exporter 1.10, Grafana 11.6) can watch a 10-server homelab on one Raspberry Pi 4 or a small VM with 1GB RAM. The community Node Exporter Full dashboard (Grafana ID 1860) gives you production-grade views in under 30 minutes.
This guide walks the full setup from layout to dashboards. It covers config files, useful PromQL queries, and ways to grow into log and container monitoring.
Architecture Overview: How Prometheus and Grafana Fit Together
Before you deploy anything, it helps to know the pull-based design that sets Prometheus apart from push-based tools like Telegraf+InfluxDB or Datadog agents.
Prometheus uses a pull model. It reaches out to HTTP endpoints (called exporters) on a set scrape interval, 15 seconds by default, and grabs whatever metrics those endpoints expose. That’s the opposite of push-based stacks where agents on each server send data to a central collector. The pull model has a real upside: if a target goes down, Prometheus knows right away because the scrape fails. You don’t have to guess whether the agent crashed or the server died.
The official Prometheus architecture diagram shows how these components interact:

Image: Prometheus official documentation
Here is how the components fit together:
| Component | Role | Default Port | Resource Usage |
|---|---|---|---|
| node_exporter | Exposes hardware/OS metrics as HTTP endpoint | 9100 | ~10MB RAM |
| Prometheus | Scrapes exporters, stores time-series data in TSDB | 9090 | 512MB-1GB RAM |
| Grafana | Queries Prometheus via PromQL, renders dashboards | 3000 | ~200MB RAM |
| Alertmanager | Routes alerts to email, Slack, Discord, webhooks | 9093 | ~30MB RAM |
A typical node_exporter spits out about 700 metrics per host. Ten servers means around 7,000 active time series, which is tiny for Prometheus. The rule of thumb: Prometheus uses 1-2GB RAM per 100,000 active series, so a 10-server homelab barely shows up.
For storage, Prometheus keeps 15 days by default. For homelab use, 90 days makes more sense:
--storage.tsdb.retention.time=90dDisk use works out to about 1-2 bytes per sample. Ten servers scraped every 15 seconds for 90 days needs around 10GB. Any modern SSD handles that easily.
Why Not Telegraf+InfluxDB or Zabbix?
Telegraf+InfluxDB is a solid stack, but it’s push-based. That means setting up an agent on every host. Worse, InfluxDB 3.x dropped the open-source time-series engine, so the free tier looks weaker for self-hosters. Zabbix is powerful but heavy. It needs a MySQL or PostgreSQL backend and a lot more RAM and config work.
Prometheus+Grafana is the industry standard for cloud-native monitoring. The skills carry over to Kubernetes and work environments. Learn PromQL and Grafana for your homelab and you’re building real career skills.
If Prometheus resource use becomes a worry at scale (hundreds of servers, millions of series), VictoriaMetrics is a drop-in swap. It uses about 7x less disk and a lot less RAM. In benchmarks, it used 0.3 bytes per sample to Prometheus’s 2.1 when storing 24.5 billion data points over 24 hours. For a homelab of 10-20 servers, though, Prometheus is more than enough.
Installing and Configuring node_exporter on Each Server
node_exporter is a small daemon that exposes Linux metrics over HTTP. It needs to run on every server you want to watch.
Installation
Grab the latest binary from the node_exporter releases page . The current version is 1.10.2.
# Download and extract
wget https://github.com/prometheus/node_exporter/releases/download/v1.10.2/node_exporter-1.10.2.linux-amd64.tar.gz
tar xzf node_exporter-1.10.2.linux-amd64.tar.gz
sudo cp node_exporter-1.10.2.linux-amd64/node_exporter /usr/local/bin/

# Create a dedicated system user
sudo useradd --no-create-home --shell /usr/sbin/nologin node_exporter
Systemd Service
Create the service file at /etc/systemd/system/node_exporter.service:
[Unit]
Description=Prometheus Node Exporter
After=network-online.target
Wants=network-online.target

[Service]
User=node_exporter
Group=node_exporter
Type=simple
ExecStart=/usr/local/bin/node_exporter \
    --web.listen-address=:9100 \
    --collector.systemd \
    --collector.processes

[Install]
WantedBy=multi-user.target
Enable and start the service:
sudo systemctl daemon-reload
sudo systemctl enable --now node_exporter
Verify it is working by hitting the metrics endpoint:
curl -s http://localhost:9100/metrics | head -20You should see lines like node_cpu_seconds_total, node_memory_MemTotal_bytes, and node_filesystem_avail_bytes.
Choosing Collectors
node_exporter turns on about 40 collectors by default. That includes cpu, diskstats, filesystem, loadavg, meminfo, netdev, netstat, uname, and time. These cover 95% of homelab needs with no extra setup.
Two optional collectors worth turning on:
--collector.systemdshows systemd service states (running, failed, inactive). Handy for alerts when a key service dies.--collector.processesadds per-process state counts. Useful for spotting zombies or runaway forks.
If you have hardware or subsystems you don’t use, turn off those collectors to cut metric volume:
--no-collector.infiniband --no-collector.nfs --no-collector.zfsFewer metrics means less Prometheus storage and faster dashboards.
Security Considerations
node_exporter metrics should never face the public internet. The easy options:
- Bind to a private interface:
--web.listen-address=192.168.1.100:9100 - Use firewall rules to limit access to your Prometheus server’s IP
- Run your monitoring net over Tailscale zero-config mesh VPN . node_exporter listens on the Tailscale interface, and only devices on your tailnet can reach it.
- For TLS, use
--web.config.filewith a YAML file naming the cert and key paths
Deploying Prometheus and Writing Scrape Configs
Prometheus is the central time-series database. It scrapes all your node_exporters and stores the data locally.
Installation
The cleanest path is to grab the official binary:
wget https://github.com/prometheus/prometheus/releases/download/v3.10.0/prometheus-3.10.0.linux-amd64.tar.gz
tar xzf prometheus-3.10.0.linux-amd64.tar.gz
sudo cp prometheus-3.10.0.linux-amd64/{prometheus,promtool} /usr/local/bin/
sudo mkdir -p /etc/prometheus /var/lib/prometheus
Or run it as a Docker container:
docker run -d \
  --name prometheus \
  -p 9090:9090 \
  -v /etc/prometheus:/etc/prometheus \
  -v prometheus-data:/prometheus \
  prom/prometheus:latest \
  --config.file=/etc/prometheus/prometheus.yml \
  --storage.tsdb.retention.time=90d
prometheus.yml Configuration
Here is a practical starting configuration:
global:
  scrape_interval: 15s
  evaluation_interval: 15s

rule_files:
  - "alerts.yml"
  - "recording_rules.yml"

scrape_configs:
  - job_name: "prometheus"
    static_configs:
      - targets: ["localhost:9090"]

  - job_name: "linux-servers"
    static_configs:
      - targets: ["192.168.1.10:9100"]
        labels:
          hostname: "server1"
          role: "docker-host"
      - targets: ["192.168.1.11:9100"]
        labels:
          hostname: "server2"
          role: "nas"
      - targets: ["192.168.1.12:9100"]
        labels:
          hostname: "server3"
          role: "k3s-node"
File-Based Service Discovery
Hardcoding targets works for a few servers, but file-based discovery scales better. Instead of listing targets in prometheus.yml, point to a folder of JSON files:
scrape_configs:
  - job_name: "linux-servers"
    file_sd_configs:
      - files:
          - "/etc/prometheus/targets/*.json"
        refresh_interval: 5m
Then create /etc/prometheus/targets/servers.json:
[
  {
    "targets": ["192.168.1.10:9100", "192.168.1.11:9100"],
    "labels": {
      "env": "homelab",
      "location": "rack1"
    }
  }
]
Add or drop servers by editing this JSON file. Prometheus picks up changes within the refresh interval. No restart needed.
Recording Rules for Dashboard Performance
Pre-computing costly queries as recording rules speeds up dashboards. Create /etc/prometheus/recording_rules.yml:
groups:
  - name: node_exporter_recording
    rules:
      - record: instance:node_cpu_utilisation:rate5m
        expr: 1 - avg without(cpu) (rate(node_cpu_seconds_total{mode="idle"}[5m]))

      - record: instance:node_memory_utilisation:ratio
        expr: 1 - (node_memory_MemAvailable_bytes / node_memory_MemTotal_bytes)

      - record: instance:node_filesystem_utilisation:ratio
        expr: 1 - (node_filesystem_avail_bytes{mountpoint="/"} / node_filesystem_size_bytes{mountpoint="/"})
These turn per-core metrics into single usage percentages. On larger setups, Grafana query time drops from seconds to milliseconds.
Alerting Rules
Create /etc/prometheus/alerts.yml for critical conditions:
groups:
  - name: node_alerts
    rules:
      - alert: HostDown
        expr: up == 0
        for: 2m
        labels:
          severity: critical
        annotations:
          summary: "Host {{ $labels.instance }} is unreachable"

      - alert: DiskSpaceLow
        expr: (node_filesystem_avail_bytes / node_filesystem_size_bytes) < 0.1
        for: 5m
        labels:
          severity: warning
        annotations:
          summary: "Disk space below 10% on {{ $labels.instance }}"

      - alert: HighCPU
        expr: instance:node_cpu_utilisation:rate5m > 0.9
        for: 10m
        labels:
          severity: warning
        annotations:
          summary: "CPU above 90% on {{ $labels.instance }} for 10 minutes"

      - alert: HighMemory
        expr: instance:node_memory_utilisation:ratio > 0.9
        for: 5m
        labels:
          severity: warning
        annotations:
          summary: "Memory above 90% on {{ $labels.instance }}"
After starting Prometheus, check that it works at http://prometheus-host:9090/targets. All targets should show a green “UP” status.
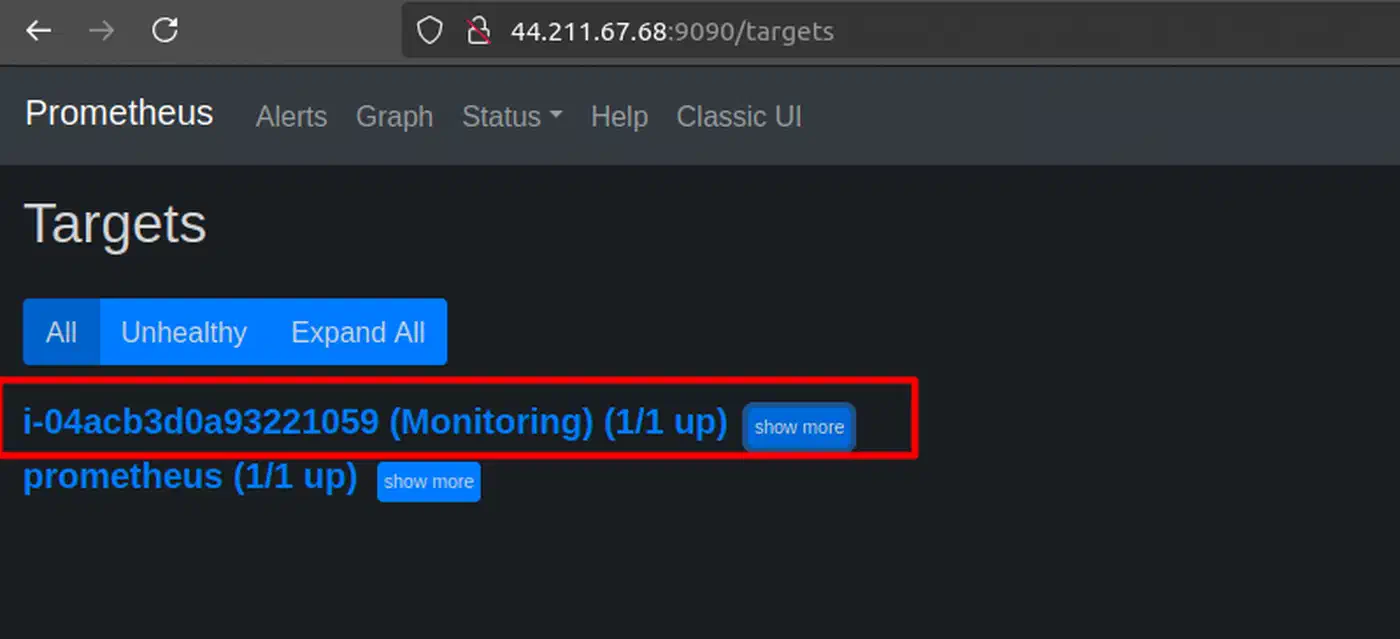
Image: ToTheNew Blog
Essential PromQL Queries
Here are ten PromQL queries that cover the most common homelab needs:
| What You Want | PromQL Query |
|---|---|
| CPU usage percentage | 1 - avg by(instance)(rate(node_cpu_seconds_total{mode="idle"}[5m])) |
| Available memory in GB | node_memory_MemAvailable_bytes / 1024^3 |
| Disk usage percentage | 1 - (node_filesystem_avail_bytes{mountpoint="/"} / node_filesystem_size_bytes{mountpoint="/"}) |
| Network receive rate (Mbps) | rate(node_network_receive_bytes_total{device="eth0"}[5m]) * 8 / 1e6 |
| Disk I/O read rate | rate(node_disk_read_bytes_total[5m]) |
| System load (1 min) | node_load1 |
| Uptime in days | (time() - node_boot_time_seconds) / 86400 |
| Failed systemd services | node_systemd_unit_state{state="failed"} == 1 |
| Swap usage | 1 - (node_memory_SwapFree_bytes / node_memory_SwapTotal_bytes) |
| Open file descriptors | node_filefd_allocated |
Building Grafana Dashboards for Server Monitoring
Grafana turns raw Prometheus metrics into visual dashboards. You get graphs, gauges, stat panels, and built-in alerts.
Installation
Add the official Grafana APT repo and install:
sudo apt-get install -y apt-transport-https software-properties-common
sudo mkdir -p /etc/apt/keyrings/
wget -q -O - https://apt.grafana.com/gpg.key | gpg --dearmor | sudo tee /etc/apt/keyrings/grafana.gpg > /dev/null
echo "deb [signed-by=/etc/apt/keyrings/grafana.gpg] https://apt.grafana.com stable main" | sudo tee /etc/apt/sources.list.d/grafana.list
sudo apt-get update
sudo apt-get install grafana
sudo systemctl enable --now grafana-server
Or run it as a Docker container:
docker run -d \
  --name grafana \
  -p 3000:3000 \
  -v grafana-data:/var/lib/grafana \
  grafana/grafana-oss:latest
Open Grafana at http://<host>:3000 with the default login admin/admin. It’ll prompt you to change the password on first login.
Adding Prometheus as a Data Source
Go to Connections > Data Sources > Add data source > Prometheus. Set the URL to http://localhost:9090 (or the Prometheus host’s IP if it’s on a different machine). Click Save & Test to check the link. That’s the only setup step before you can start building dashboards.
Importing the Node Exporter Full Dashboard
Instead of building dashboards from scratch, import the community Node Exporter Full dashboard :
- Go to Dashboards > New > Import
- Enter dashboard ID
1860 - Select your Prometheus data source
- Click Import
This one dashboard gives you CPU usage graphs, memory breakdown, disk I/O rates, network traffic, filesystem space gauges, system load curves, and network connection tracking per server. A dropdown at the top lets you switch between hosts.
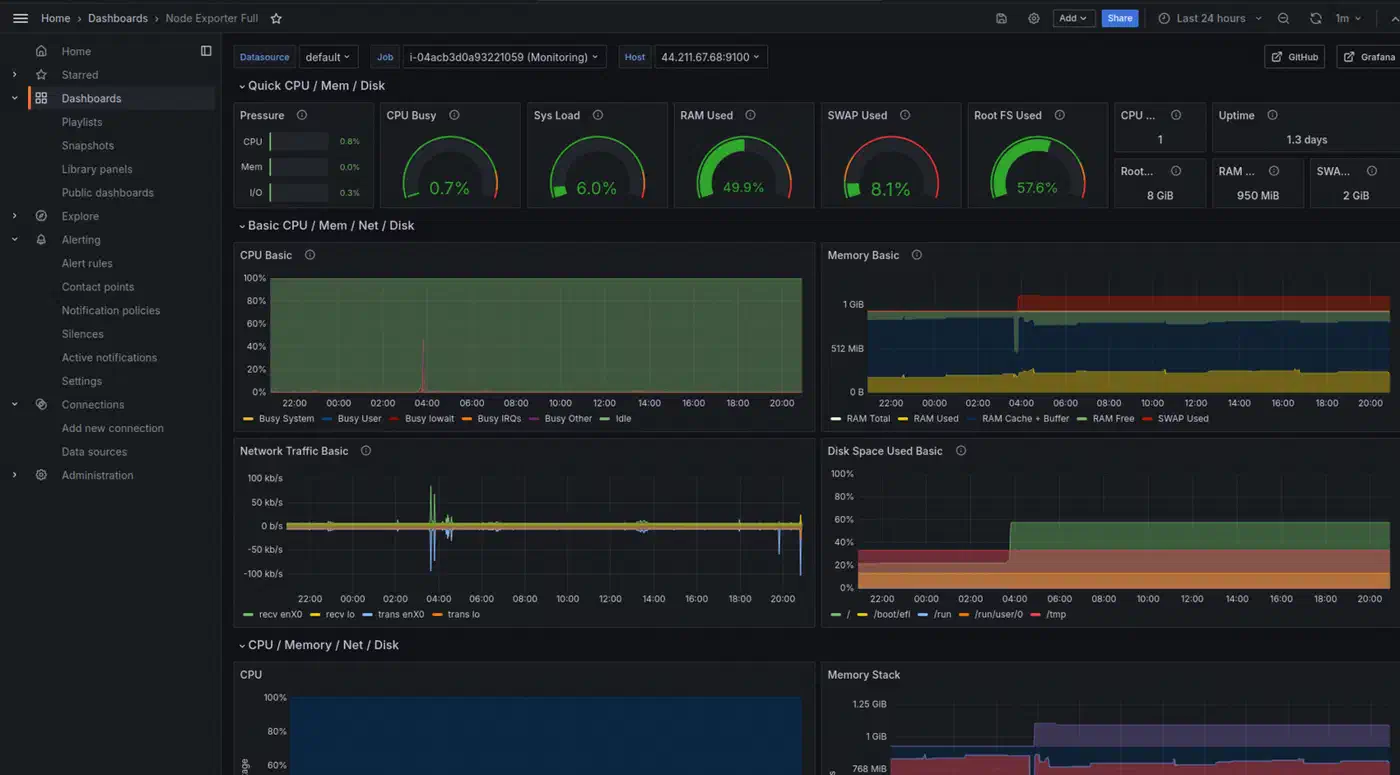
Image: ToTheNew Blog
Building a Custom Homelab Overview Dashboard
The Node Exporter Full dashboard is detailed but locked to one host at a time. For a fleet view, build a custom dashboard with these panels:
A stat panel using up{job="linux-servers"} with value mappings (1 = green “UP”, 0 = red “DOWN”) gives you an at-a-glance status for every server. Pair it with a table panel on the same metric to list all servers, their status, and last scrape time.
For network views, a time series panel plotting rate(node_network_receive_bytes_total[5m]) * 8 across all hosts shows total throughput over time. Add gauge panels per server for root filesystem usage, colored green/yellow/red at 60%/80%/90% thresholds. These tend to be the panels you actually look at most.
Alert Configuration in Grafana
Grafana has its own alert engine that runs apart from Prometheus Alertmanager. Set up contact points under Alerting > Contact points:
- Email via SMTP
- Slack or Discord webhooks
- Gotify for self-hosted push notifications
- PagerDuty or Opsgenie for on-call rotation
Create alert rules right on dashboard panels. Useful examples: alert when disk use tops 85%, when a server’s up metric drops to 0 for over 2 minutes, or when CPU stays above 90% for 10 minutes.
Dashboard Provisioning
For repeat setups, store dashboard JSON exports and data source configs in Grafana’s provisioning folders:
/etc/grafana/provisioning/
  dashboards/
    dashboard.yml          # Points to dashboard JSON directory
    homelab-overview.json  # Exported dashboard JSON
  datasources/
    prometheus.yml         # Prometheus data source config
This lets you rebuild your Grafana instance from version-controlled config files. That helps when you move to a new server or recover from a crash.
Expanding the Stack: Loki for Logs, cAdvisor for Containers
Once basic metrics are running, the next steps are central log collection and container monitoring.
Grafana Loki for Centralized Logs
Grafana Loki is a log system built to plug into Grafana. Unlike Elasticsearch, Loki only indexes labels (hostname, service name, log level) instead of every word in every log line. That makes it much cheaper to run. A Loki instance for a 10-host homelab needs just 256-512MB of RAM.
The current version is Loki 3.7. One key change: Promtail, the old log-shipping agent, hit end-of-life in March 2026. Grafana Alloy is its swap-in. Alloy does the same job, tailing logs and shipping them to Loki, but also handles OpenTelemetry traces and Prometheus metrics in one agent.
Set up Alloy to scrape /var/log/syslog, /var/log/auth.log, and systemd journal logs. Add labels for hostname and service. In Grafana, you can then query logs with LogQL right next to your Prometheus metrics. That lets you tie a CPU spike to the exact log lines just before it. The same Loki setup is a natural home for the build logs your Gitea Actions runner produces, so failed runs surface alongside the rest of your fleet data.
cAdvisor for Docker and Podman Containers
If you run Docker or Podman, cAdvisor shows per-container CPU, memory, network, and disk metrics. Run it as a container itself:
docker run -d \
  --name cadvisor \
  -p 8080:8080 \
  -v /:/rootfs:ro \
  -v /var/run:/var/run:ro \
  -v /sys:/sys:ro \
  -v /var/lib/docker/:/var/lib/docker:ro \
  gcr.io/cadvisor/cadvisor:latest
Add cAdvisor as a Prometheus scrape target on port 8080. Then import Grafana dashboard ID 19792 or 19908 for container-level views.
Blackbox Exporter for Endpoint Monitoring
The blackbox_exporter probes HTTP endpoints, TCP ports, ICMP ping, and DNS queries from the outside. Use it to check that your public services actually respond. Make sure your website returns HTTP 200, your mail server’s port 25 is open, and DNS resolves right. It also reads TLS expiry dates, so it pairs well with Let’s Encrypt wildcard certs issued through DNS validation and warns you before any of them lapse.
If blackbox_exporter’s relabel config feels too dense, Uptime Kuma gives you a web UI for HTTP, TCP, DNS, and ping checks with built-in alerts. It doesn’t feed metrics into Prometheus, but it answers the “is my service up?” question with little setup. For a more Prometheus-native route, Gatus serves a self-hosted status page with built-in alerts and check history, all set via YAML.
Complete Stack Resource Summary
Here’s what the full stack uses in resources for a 10-host homelab:
| Component | Per Host | Central Server |
|---|---|---|
| node_exporter | ~10MB RAM | - |
| Grafana Alloy (log shipping) | ~30MB RAM | - |
| Prometheus | - | 512MB-1GB RAM |
| Grafana | - | ~200MB RAM |
| Loki | - | 256-512MB RAM |
| cAdvisor | ~50MB RAM | - |
| Total central | - | ~1.5-2GB RAM |
The full central server fits fine on a 2-core/2GB VM, a $5/month VPS, or a Raspberry Pi 4 with 4GB RAM. The per-host agents (node_exporter + Alloy) add under 50MB each. That’s invisible on any modern server.
Docker Compose for One-Command Deployment
To get the central stack running fast, here’s a docker-compose.yml that starts Prometheus, Grafana, and Alertmanager together:
version: "3.8"

services:
  prometheus:
    image: prom/prometheus:latest
    container_name: prometheus
    ports:
      - "9090:9090"
    volumes:
      - ./prometheus/prometheus.yml:/etc/prometheus/prometheus.yml
      - ./prometheus/alerts.yml:/etc/prometheus/alerts.yml
      - ./prometheus/recording_rules.yml:/etc/prometheus/recording_rules.yml
      - prometheus-data:/prometheus
    command:
      - "--config.file=/etc/prometheus/prometheus.yml"
      - "--storage.tsdb.retention.time=90d"
      - "--storage.tsdb.wal-compression"
    restart: unless-stopped

  grafana:
    image: grafana/grafana-oss:latest
    container_name: grafana
    ports:
      - "3000:3000"
    volumes:
      - grafana-data:/var/lib/grafana
      - ./grafana/provisioning:/etc/grafana/provisioning
    environment:
      - GF_SECURITY_ADMIN_PASSWORD=changeme
    restart: unless-stopped

  alertmanager:
    image: prom/alertmanager:latest
    container_name: alertmanager
    ports:
      - "9093:9093"
    volumes:
      - ./alertmanager/alertmanager.yml:/etc/alertmanager/alertmanager.yml
    restart: unless-stopped

volumes:
  prometheus-data:
  grafana-data:
Run docker compose up -d and the whole monitoring backend starts in seconds. Point your prometheus.yml scrape targets at the node_exporter instances on your other servers. Import dashboard 1860 in Grafana, and you’ve got production-grade Linux server monitoring running.
From here, you can add Loki for logs, cAdvisor for container metrics, and blackbox_exporter for endpoint probing. All as extra services in the same compose file. Start with the basics and add bits as you need them. When you want to expose Grafana on HTTPS, pair this compose setup with Traefik for automatic TLS and routing so you don’t have to manage certs by hand.