 Botmonster Tech
AI code quality crisis: why enterprise codebases degrade 4.94x faster after AI adoption
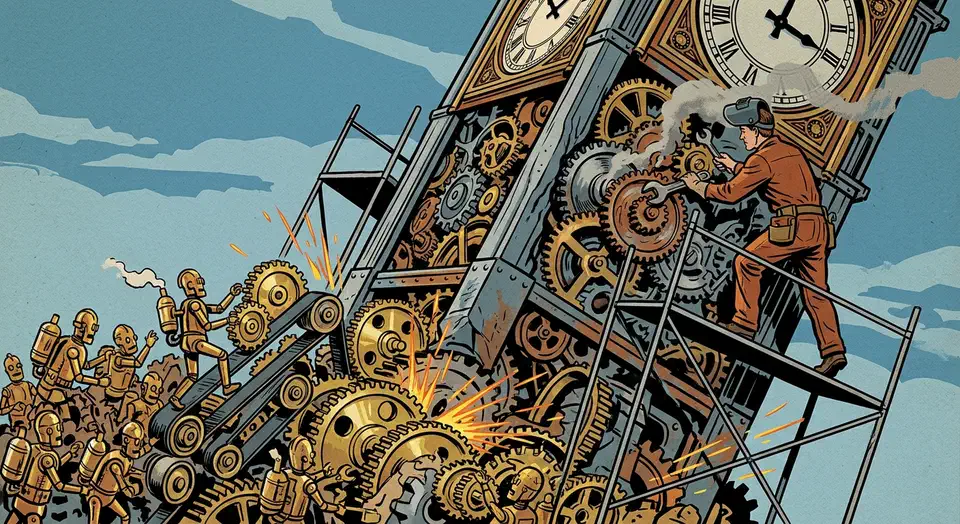
Enterprise codebases adopting AI coding tools degrade fast. Static analysis warnings rise 30%. Code complexity climbs 41%. Technical debt balloons up to 4.94x in 90 days. Developers feel faster but ship slower. Fewer than one in five companies have governance mature enough to catch the spiral.
The Adoption Numbers Behind the Problem
AI coding tools have crossed from optional to structural. GitHub and Stack Overflow surveys show 84% of developers now use or plan to use them, and 51% used them daily by mid-2025. By late 2025, 90% of engineering teams had AI in their workflows, up from 61% the year before. That’s one of the fastest adoption curves in software history.
The numbers bear this out. 41% of all new code is now AI-generated worldwide, a figure tracked across 2025 and into 2026. GitHub Copilot crossed 20 million all-time users by mid-2025. Cursor hit deep enterprise reach with its Teams tier at $40 per user per month. The shift isn’t just autocomplete. AI now sits inside editors, CI/CD pipelines, doc workflows, and code review. So its quality effects compound across the whole software lifecycle.
These numbers set the stage. When 9 out of 10 engineering teams use AI coding and nearly half of new code is machine-written, the quality fallout isn’t a niche worry. It’s an enterprise-wide structural risk.
The Complexity and Technical Debt Escalation
Many engineering leads suspected it. Now studies show it. AI-generated code drags quality down in every way you can measure.
One study tracked repos in the first 90 days after AI tool rollout. LLM agent use lifts static analysis warnings by 30% and code complexity by 41%. Technical debt rises up to 4.94x. A separate dataset shows AI code ships 1.7x more total issues than human code. Maintainability errors run 1.64x higher. Logic and correctness errors run 1.75x higher. And security findings hit 1.57x higher .
GitClear’s 2025 study of 211 million changed lines (2020 to 2024) tells the same story. Duplicated code blocks rose eightfold in 2024. Refactored code fell from 25% of changed lines in 2021 to under 10% by 2024. Copy-pasted lines jumped from 8.3% to 12.3%. And 2024 was the first year copy-pasted lines beat moved lines. These trends track step for step with AI coding tool growth.
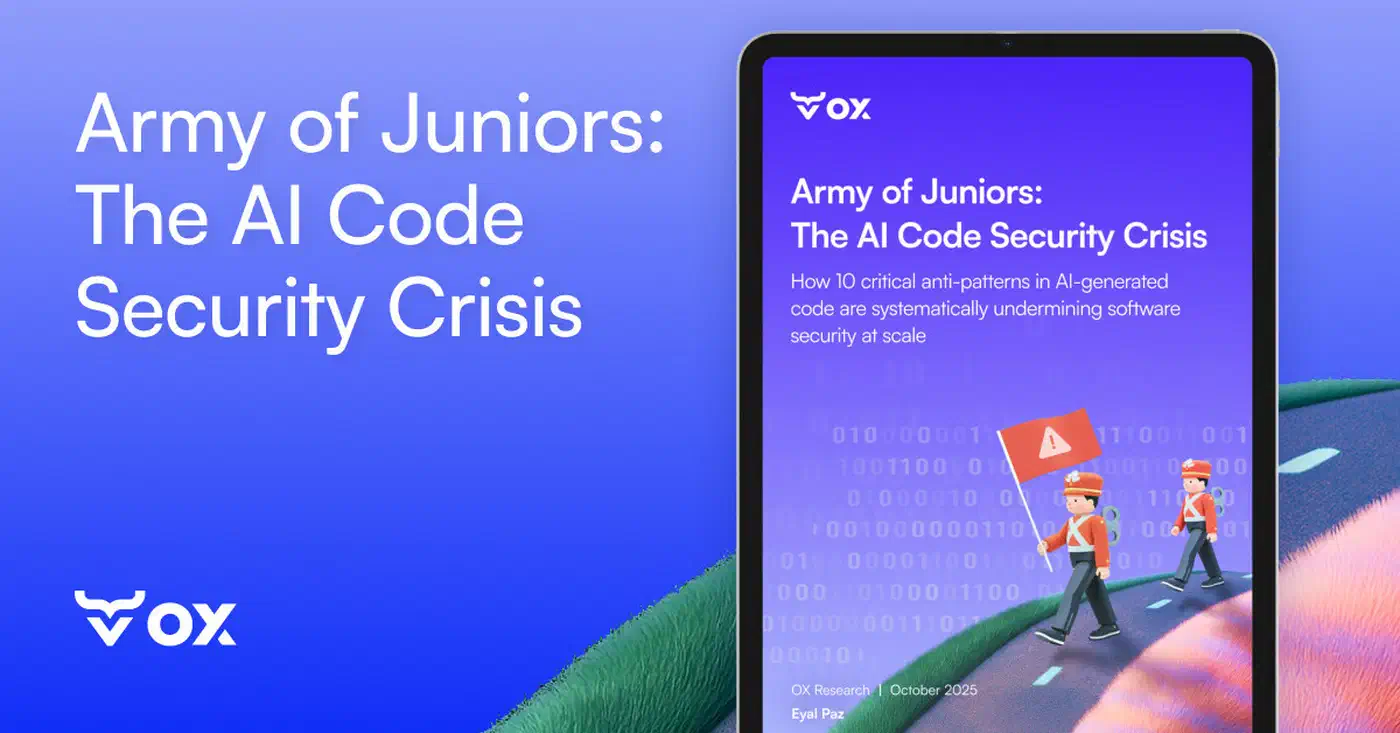
Ox Security looked at over 300 repos and named 10 anti-patterns that show up in 80 to 100% of AI code. The worst ones: too many comments (90 to 100% of AI code), over-built single-use code (80 to 90%), and refactoring dodged (80 to 90%). Their report calls AI tools an “Army of Juniors”: fast, working code that lacks design sense and security smarts.
The fallout is already in production metrics. Change failure rates climb 30% and incidents per pull request rise 23.5% after AI rollout. One Fortune 50 case saw API security findings jump 10x in six months: from 1,000 to over 10,000 monthly bugs between December 2024 and June 2025. Unmanaged AI code pushes upkeep costs to 4x normal by year two as debt piles up. First-year costs already run 12% higher once you count the 9% review overhead, the 1.7x testing load, and the 2x code churn needing rewrites. These risks aren’t theory. One AI agent wiped 2.5 years of production data in a single unwatched infra run.
Gartner projects 75% of tech leaders will face moderate to severe debt from AI-speed work by 2026. Given we’re in 2026, the forecast is no longer about the future. It’s about now.
| Metric | Before AI Adoption | After AI Adoption (90 days) | Change |
|---|---|---|---|
| Static analysis warnings | Baseline | +30% | Increase |
| Code complexity (cyclomatic) | Baseline | +41% | Increase |
| Technical debt ratio | Baseline | Up to 4.94x | Increase |
| Duplicated code blocks | Baseline (2020) | 8x (2024) | Increase |
| Refactored code share | 25% (2021) | <10% (2024) | Decrease |
| Copy/pasted lines | 8.3% (2020) | 12.3% (2024) | Increase |
| Change failure rate | Baseline | +30% | Increase |
| Incidents per PR | Baseline | +23.5% | Increase |
The Productivity Paradox - Feeling Faster While Shipping Worse
The 2025 METR study is the tightest controlled test of AI coding tool speed so far. It tapped 16 senior open-source devs on repos with 22,000+ stars and over 1 million lines. METR took 246 real issues and split them at random: AI allowed, or AI not allowed.
The measured result: devs using AI tools took 19% longer than devs working without AI.
The gap between what devs felt and what the clock showed is the scary part. After the study, devs guessed they were 20% faster with AI. Before tasks, they had forecast 24% time savings. That’s a 39 to 44% gap between gut feel and real output. The main tools were Cursor Pro and Claude 3.5/3.7 Sonnet: the same tools most enterprises are picking as standard.
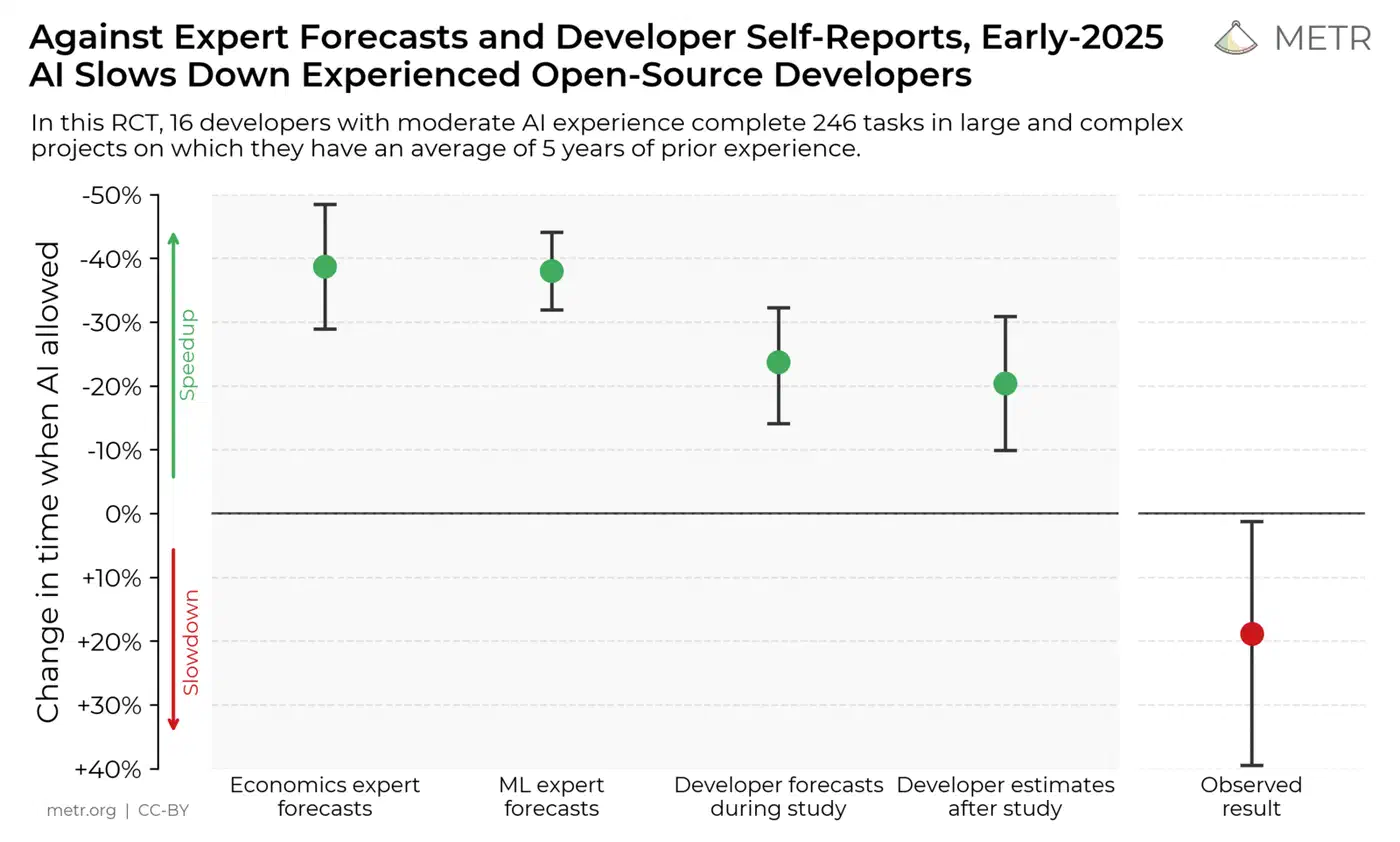
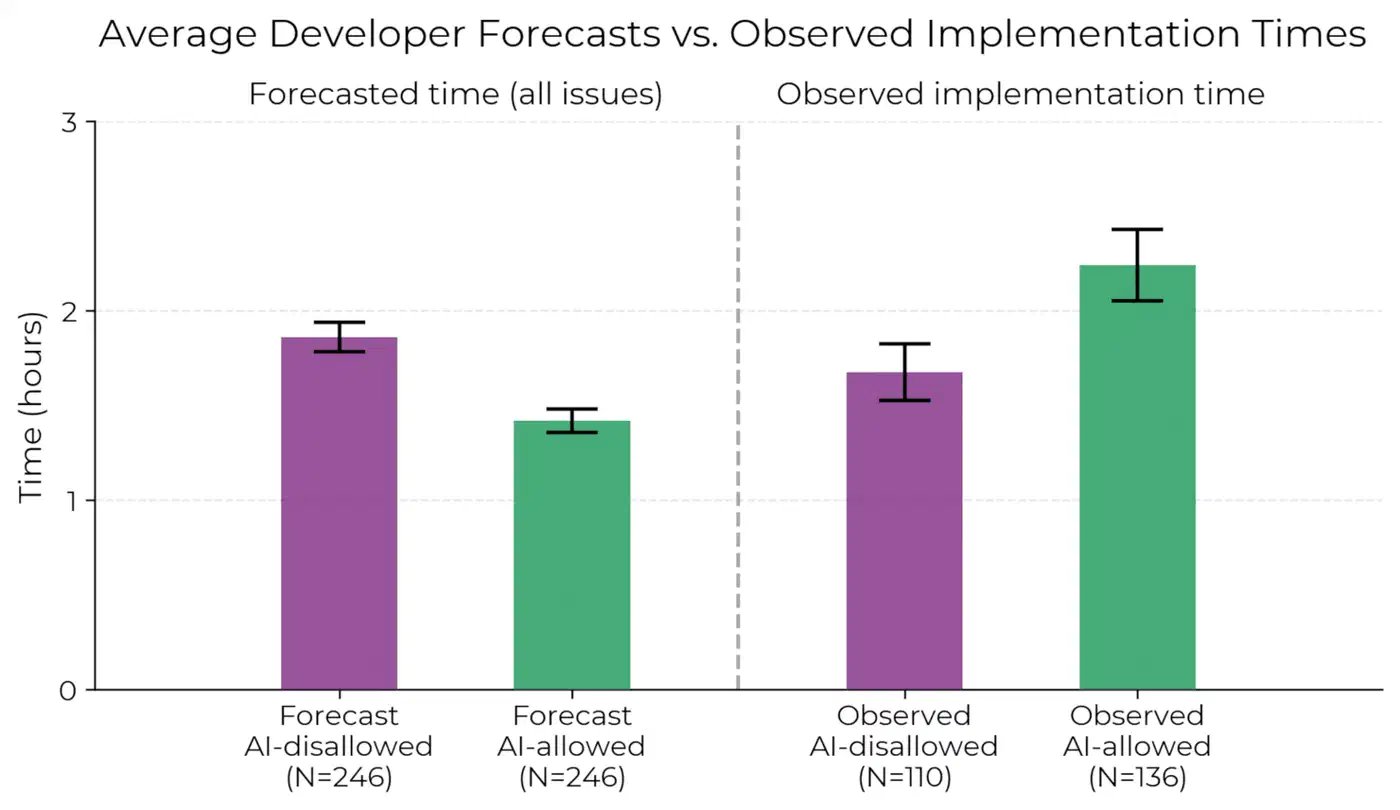
METR pinned “low AI reliability” as the main drag. Devs spent a lot of time double-checking outputs. AI tools couldn’t tap the deep know-how senior devs carry about their own codebase. The AI treated every prompt as if the dev had never seen the code before.
Broad surveys claim average time savings of 3.6 hours per dev per week. But METR’s controlled test shows those self-reports don’t hold up for senior devs on a codebase they know. The paradox hits budgets too. ROI math built on self-reported gains may overstate the win and ignore the drag of more defects, 91% longer code review times , and 154% larger pull requests.
Devs are starting to clock the pattern. Stack Overflow’s 2025 survey found trust in AI code accuracy fell from 40% to 29% in one year. 46% of devs now actively distrust AI output.
Why Governance Fails and What Mature Programs Look Like
Most enterprises met AI with policy docs, and the results haven’t been good. Only about 21% of firms running AI report mature governance, per Deloitte’s 2026 State of AI in the Enterprise survey. Cisco’s survey puts the number even lower at 12%.
The gap shows in the numbers. 75% of firms plan to ship agentic AI within two years. Yet fewer than a quarter have the setup to manage the code it writes. The AI governance and compliance market hit $2.2 billion in 2025 and is set to reach $11 billion by 2036 at 15.8% CAGR (Future Market Insights). Spending is climbing, but it trails adoption by years.
What failing governance looks like: A PDF of “AI usage guidelines” emailed to engineering. No automated checks. No complexity metrics tracked. No tag for AI-caused defects. No loop from production bugs back to AI tool setup.
What working governance looks like: Automated quality gates in CI/CD : cyclomatic complexity caps, function length limits, Halstead volume checks. Live dashboards that track AI vs. human code quality side by side. Mandatory human review for AI-authored changes past a complexity threshold. Incident playbooks built for AI code failures.
CIOs who win at this run governance as a cross-functional operating skill . The CIO owns the frame and the tooling. The CFO, CMO, and COO own compliance in their own areas. AI governance is a business risk topic as much as a tech one. Presidio’s review of enterprise programs makes the same call.
Rules are pushing this faster too. The EU AI Act makes high-risk AI systems meet rules for transparency, docs, and risk management by August 2, 2026. If your software serves EU residents, you’re on the hook under the law, no matter where you’re based. For firms using AI to write production code, governance is now a compliance must, not just good practice.
Choosing the Right Static Analysis Tools
The tooling for spotting AI-specific code quality issues is growing up fast. Here’s how the big platforms stack up:
| Tool | Languages | AI-Specific Detection | Key Strength | Limitation |
|---|---|---|---|---|
| SonarQube | 30+ | Indirect (complexity rules) | Large rule library, enterprise mature | High false positive rates, complex setup |
| DeepSource | 16+ | Hybrid engine (static + AI review) | <5% false positive guarantee | Smaller rule library than Sonar |
| CodeClimate (qlty) | 10+ | Maintainability GPA scoring | Clear quantitative tech debt tracking | No SAST/SCA, no AI code review |
| Ox Security | Multi-language | 10 AI anti-pattern detection | Purpose-built for AI code patterns | Newer entrant, less enterprise history |
A practical start: tag your codebase so you can split AI from human code with GitClear, Sonar, or custom metadata. Then track quality metrics for each side on its own. You can’t govern what you don’t measure.
The 90-Day Action Plan for Engineering Leaders
Research is useful, but engineering leaders need steps to act on. Here’s a sequenced plan ranked by impact and difficulty.
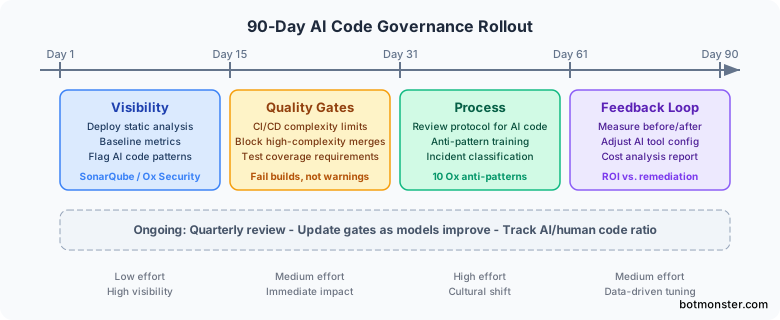
Days 1-14 (Visibility): Roll out static analysis that can flag AI code patterns: SonarQube, CodeClimate, or Ox Security’s anti-pattern checks. Baseline your current complexity, duplication, and defect numbers before you change a thing. If you don’t measure the start, you won’t know if governance is working.
Days 15-30 (Gates): Add automated quality gates to CI/CD. Block merges that push cyclomatic complexity past a cap. Flag any function over 50 lines. Require test coverage for AI code at the same level as human code, or higher. These gates should fail builds, not just spit out warnings everyone learns to ignore.
Days 31-60 (Process): Set a mandatory review rule for AI code over a size or complexity cap. Train senior devs on the 10 Ox Security anti-patterns so they know the tells: too many comments, over-specification, no refactoring, bugs deja-vu, and the rest. Add an “AI-originated defect” tag to your incident tracker.
Days 61-90 (Feedback Loop): Measure the impact. Compare defect rates, review times, and complexity trends before and after governance. Tune AI tool settings (model choice, prompt limits, context window size) from the data. Report results to leadership with a cost view that weighs productivity gains against the cost of fixing quality issues.
Ongoing: Review every quarter. Update quality gates as AI models get better. Track the AI vs. human code ratio and tie it to production incident rates. Share findings across teams so governance becomes normal engineering practice, not red tape.
A few prompt tweaks cut anti-pattern rates a lot. Tell models to refactor existing functions, not write new ones. Set hard function length limits in the system prompt. Make models explain their design choices before writing code. These tweaks are cheap. Early enterprise reports say they cut duplication and over-specification by 30 to 40%.
The Bottom Line
The 4.94x complexity problem is real, repeatable, and showing up in many datasets. It’s costing enterprises real money. The firms dodging the worst of it share one trait. They treated AI code governance as core infra from day one, before adoption hit critical mass.
The window for getting ahead of this is closing. With 41% of new code AI-written and climbing, every quarter without quality gates is a quarter of debt piling up. The cost to catch up grows fast. The cost to start now is one CI/CD config change and a week of baselining metrics.
The evidence leaves little room for debate on whether AI coding tools drag code quality at scale. The question left is whether your team builds the operating skill to contain that drop before the 90-day arc plays out.