Debug C, C++, Rust Programs: GDB 17.1 & LLDB 22.1 Guide

GDB and LLDB are the two workhorses of compiled-language debugging. If you write C, C++, or Rust, knowing these tools saves you hours of staring at printf output. GDB 17.1 is the default debugger on Linux. LLDB 22.1 ships with the LLVM toolchain and is the default on macOS. Both handle Rust binaries through rustc’s DWARF debug info. This guide covers the commands and workflows you actually need: from your first breakpoint to a segfault from a core dump.
When to Reach for a Debugger Instead of Print Statements
Most of us default to printf-debugging, and it works fine for simple problems. But sometimes scattering print calls through your code wastes more time than it saves.
Crashes are the clear case. When a program hits a segfault (SIGSEGV), abort (SIGABRT), or bus error (SIGBUS), it ends before flushing stdout. Your printf calls show nothing. A debugger catches the signal and shows the exact line and the full backtrace at the moment of the crash.
Race conditions are next. If you’re chasing a Heisenbug, adding I/O calls shifts timing enough to hide the bug. Conditional breakpoints and watchpoints have far less timing impact than writing to stdout on every loop.
Then there’s complex data structures. Inspecting a tree, linked list, or hash map with printf means writing throwaway format code every time. The debugger’s print command shows the full structure in one shot. Both GDB and LLDB ship with pretty printers for standard library types. For finding bugs before they reach the debugger, property-based testing
is a strong helper. It generates edge-case inputs that often trigger the very crashes a debugger has to chase down.
Getting Started
The setup is small. Compile with debug symbols and no optimizations, so variable values don’t get optimized away:
# C / C++
gcc -g -O0 main.c -o main
clang -g -O0 main.c -o main

# Rust (debug profile includes symbols by default)
cargo build
Launch the debugger and run your program:
# GDB
gdb ./myprogram
(gdb) run arg1 arg2

# LLDB
lldb ./myprogram
(lldb) run arg1 arg2
Both can attach to a running process with attach <pid>. That is key for debugging services and long-running programs.
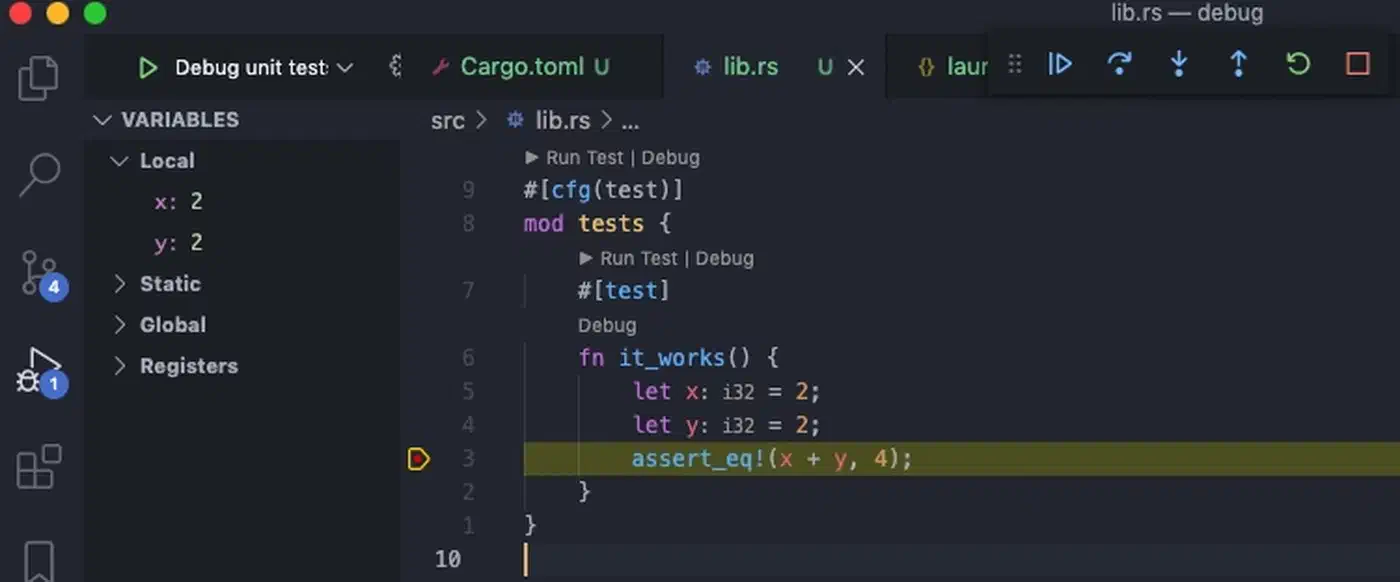
For IDE users, VS Code’s C/C++ extension drives GDB or LLDB under the hood via launch.json. The CodeLLDB
extension adds Rust-aware LLDB support in VS Code. CLion picks either debugger based on your toolchain. But terminal debugging is still key for SSH sessions and production boxes with no GUI.
Breakpoints, Stepping, and Program Flow Control
Choosing where your program pauses and how it moves is the core debugger skill. The most common commands, side by side:
| Action | GDB | LLDB |
|---|---|---|
| Break at function | break main | b main |
| Break at file:line | break main.c:42 | b main.c:42 |
| Break at address | break *0x400520 | b 0x400520 |
| Conditional break | break process_data if count > 100 | b process_data -c 'count > 100' |
| Temporary break | tbreak main.c:50 | b -o main.c:50 |
| List breakpoints | info breakpoints | br list |
| Disable breakpoint #3 | disable 3 | br disable 3 |
| Delete breakpoint #3 | delete 3 | br delete 3 |
Conditional breakpoints are very strong. Instead of stepping through 500 loop runs by hand to reach the one you want, break process_data if count > 100 pauses only when the test is true.
Temporary breakpoints (tbreak in GDB, b -o in LLDB) delete themselves after they hit once. They’re perfect for “run to this line and stop” without filling your breakpoint list.
Stepping Commands
Once you’ve hit a breakpoint, four commands drive what happens next:
next(step over): runs the current line, including any function calls on it, without going into themstep(step into): enters the function call on the current linefinish(step out): runs until the current function returnscontinue: runs until the next breakpoint
These commands work the same way in both GDB and LLDB.
Reverse Debugging (GDB Only)
GDB can step backward through the run history. That is gold for finding the root cause of a bug that shows up far from where it started:
(gdb) target record-full
(gdb) run
... program hits the bug ...
(gdb) reverse-next
(gdb) reverse-step
(gdb) reverse-continue
This logs every CPU step so you can rewind. The cost is heavy, so it works best on small test cases, not full apps.
Inspecting Variables, Memory, and Data Structures
Once you’ve stopped at a breakpoint, you can poke at any part of program state without planning for it ahead of time. No need to guess what to print before you run.
Printing Variables and Expressions
# Print a variable (both debuggers)
(gdb) print count
(lldb) p count

# Print an expression
(gdb) print count * 2 + offset

# Dereference a struct pointer
(gdb) print *my_struct_ptr
Format Specifiers
| Format | GDB | LLDB | Use case |
|---|---|---|---|
| Hexadecimal | print/x count | p/x count | Bit flags, addresses |
| Binary | print/t count | p/t count | Bitfields, masks |
| Address + symbol | print/a ptr | p/a ptr | Pointer debugging |
Raw Memory Examination
When you need to look at raw bytes (buffer overflows, off-by-one bugs, protocol parsing), raw memory reads are key:
# GDB: 16 bytes in hex starting at ptr
(gdb) x/16xb ptr

# GDB: 4 eight-byte words in hex
(gdb) x/4gx ptr

# LLDB equivalent
(lldb) memory read -c 16 -f x ptr
Pretty Printers
Both debuggers ship with pretty printers for standard library types. GDB has Python-based printers for std::vector, std::map, and std::string. Rust’s standard library brings GDB and LLDB printers for Vec, HashMap, String, Option, and Result. Turn them on in GDB with:
(gdb) set print pretty onRust ships wrapper scripts rust-gdb and rust-lldb that load the right pretty-print scripts for you. Use these in place of bare gdb or lldb for Rust programs. With pretty printers on, an Option::Some(42) shows as core::option::Option<i32>::Some(42), not a mess of struct fields and tag values.
Auto-Display
If you want to see a variable’s value each time the program stops:
# GDB
(gdb) display count

# LLDB
(lldb) target stop-hook add -o "p count"
This prints count at every breakpoint hit. You can watch it change step by step, no need to retype the print command.
Diagnosing Segfaults, Memory Errors, and Core Dumps
Crashes are the main reason people reach for a debugger. The workflow is simple once you know the commands.
Catching a Segfault Live
When a segfault hits under the debugger, it stops right there. Run backtrace (or just bt in both tools) to see the full call stack:
(gdb) bt
#0  0x0000555555555189 in process_item (item=0x0) at main.c:23
#1  0x00005555555551c4 in process_list (list=0x7fffffffe000, n=10) at main.c:31
#2  0x0000555555555210 in main (argc=1, argv=0x7fffffffe108) at main.c:42
This tells you where the crash hit and how you got there. Frame #0 shows a null pointer (item=0x0). That’s your bug.
Core Dump Analysis
For crashes that hit outside the debugger (in production, in CI, in overnight test runs), core dumps let you do post-mortem work:
# Enable core dumps
ulimit -c unlimited

# After a crash, load the core file
gdb ./myprogram core
# or
lldb ./myprogram -c core

# View the backtrace at crash time
(gdb) bt
The backtrace works just as if you’d caught the crash live, even though the program is no longer running.
Common Segfault Patterns
- Null pointer dereference: faulting address is
0x0or a small value like0x8(a struct field read through a null pointer) - Use-after-free: reading memory that was freed; the address looks valid but the bytes are junk or a debug fill pattern
- Stack overflow: deep recursion; the faulting address sits near the stack limit
- Buffer overflow: writing past the end of an array, stomping on nearby memory or the return address
Watchpoints
When a variable is getting corrupted but you don’t know where, watchpoints are the answer. They pause the run when a value changes:
# GDB
(gdb) watch variable
(gdb) watch *(int*)0x7fffe000    # watch a specific address

# LLDB
(lldb) w s v variable
This is key when the crash site sits far from the actual corruption. Set a watchpoint on the bad variable. The debugger stops at the exact line that writes to it.
AddressSanitizer Integration
Compile with AddressSanitizer to catch more subtle memory bugs at run time:
gcc -fsanitize=address -g main.c -o mainRun the sanitized binary under the debugger. ASan spots memory errors (use-after-free, buffer overflow, stack overflow) and fires SIGABRT. The report lists alloc, free, and access stack traces. The debugger catches the signal, so you can inspect program state at the point of detection.
Rust-Specific Considerations
Safe Rust should never segfault. If it does, the bug sits in unsafe blocks, FFI calls, or (rarely) a compiler or standard library bug. The debug workflow is the same as for C. cargo build with the default debug profile includes symbols. Then gdb target/debug/myprogram or rust-gdb target/debug/myprogram gives you the same feel as debugging C or C++. Rust’s push to wipe out memory-safety bugs from systems code keeps gaining ground. Linux kernel 7.0 now ships stable Rust support
for new driver code, cementing Rust as a first-class language for code where memory correctness is critical.
Advanced Techniques
TUI Mode (GDB)
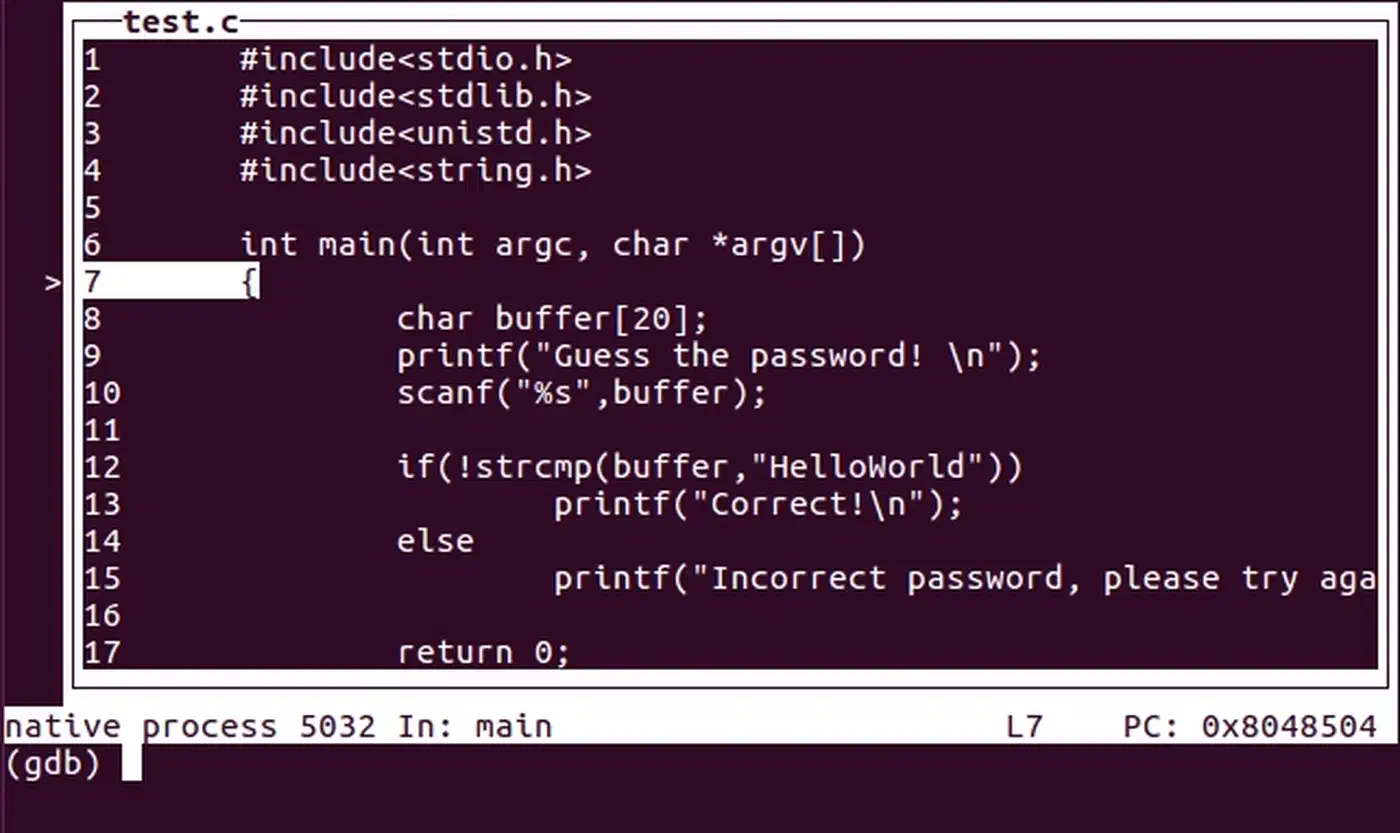
GDB’s built-in Text User Interface gives you a split-screen terminal view. You see source code, assembly, and registers next to the command prompt:
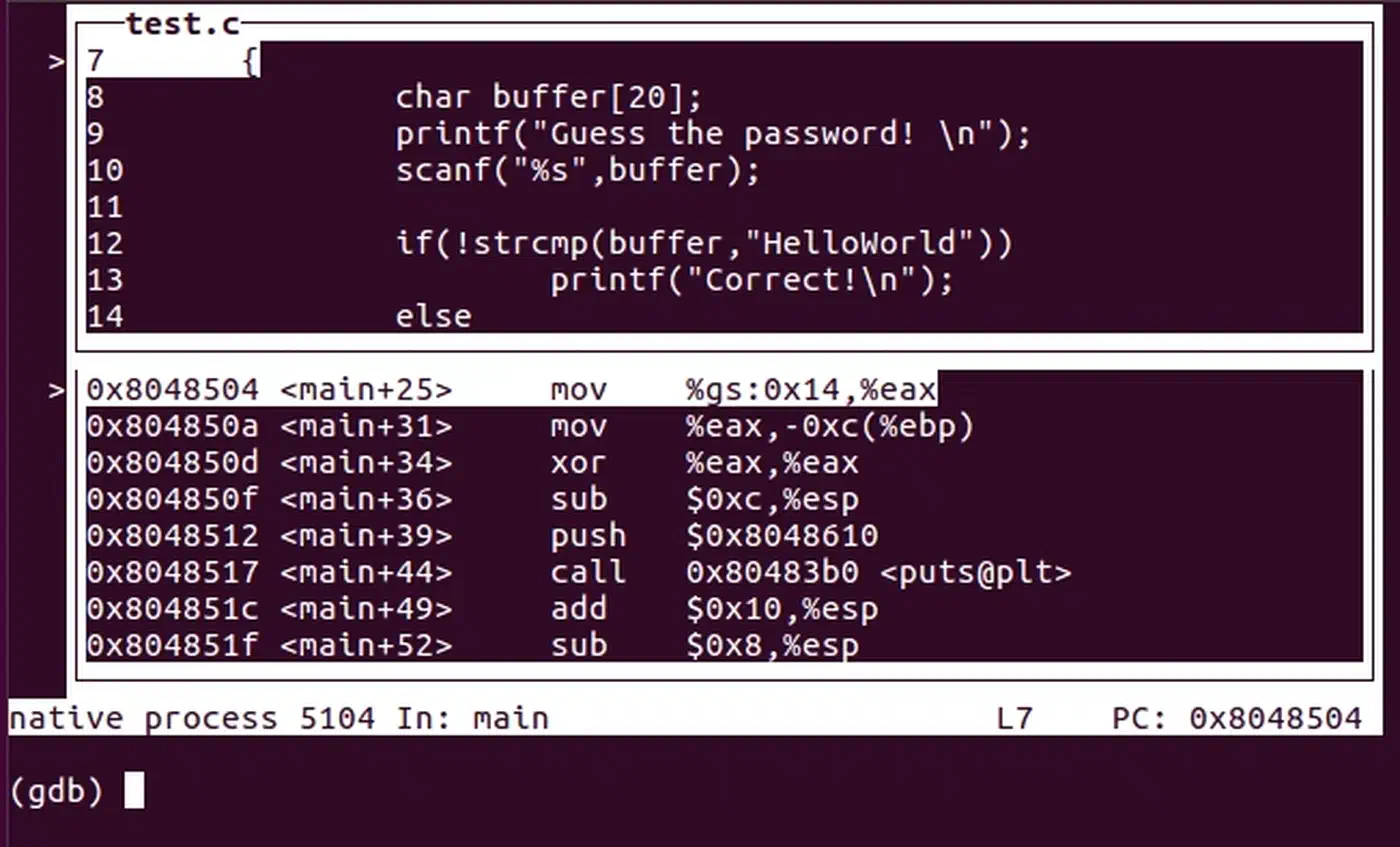
(gdb) tui enableUse layout src for source code, layout asm for assembly, layout split for both, and layout regs to add a register pane. Press Ctrl+X A to flip TUI mode on and off. This shines on remote servers where you can’t run a GUI debugger.
The split view (layout split) is handy when you need to line up source with its generated assembly. That comes up often when you debug compiler optimization issues:
Init Files
Place common settings in ~/.gdbinit or ~/.lldbinit so they load on their own:
# ~/.gdbinit
set print pretty on
set pagination off
set disassembly-flavor intel
For project-only settings, create a .gdbinit in your project folder. GDB 15+ needs you to trust it on purpose, for safety:
# In ~/.gdbinit
set auto-load safe-path /path/to/your/project
Scripting
Both debuggers ship Python APIs you can use to script repeat tasks.
GDB:
(gdb) python print(gdb.parse_and_eval("count"))You can write custom commands in ~/.gdbinit with define mycommand ... end syntax. Or use full Python scripts for deeper analysis.
LLDB:
(lldb) script import lldb; print(lldb.frame.FindVariable("count").GetValue())Create custom commands with command script add -f mymodule.my_function mycommand.
Multi-threaded Debugging
| Action | GDB | LLDB |
|---|---|---|
| List threads | info threads | thread list |
| Switch to thread 3 | thread 3 | thread select 3 |
| All thread backtraces | thread apply all bt | bt all |
In GDB, set scheduler-locking on stops only the current thread at breakpoints. Other threads keep running. That helps when you want to pin down thread-specific behavior.
Multi-process Debugging (GDB)
When debugging programs that use fork():
(gdb) set follow-fork-mode child    # debug the child after fork
(gdb) set detach-on-fork off         # keep control of both processes
(gdb) info inferiors                 # list all processes under GDB's control
(gdb) inferior 2                     # switch to process 2
By default, GDB follows the parent after a fork and lets the child run free. Set detach-on-fork off to keep control of both processes and switch between them.
Remote Debugging
For debugging on production servers, embedded devices, or containers:
# On the remote machine, start gdbserver
gdbserver :1234 ./myprogram

# On your local machine, connect
(gdb) target remote hostname:1234
For LLDB, use lldb-server on the remote side and process connect connect://hostname:1234 on the client.
Debugging in Containers
Docker’s default security profile blocks ptrace, which debuggers need. Add the SYS_PTRACE capability:
docker run --cap-add=SYS_PTRACE --security-opt seccomp=unconfined myimageFor Docker Compose:
services:
  myservice:
    cap_add:
      - SYS_PTRACE
    security_opt:
      - seccomp:unconfined
Avoid --privileged just for debugging. SYS_PTRACE is the smallest capability you need. For Kubernetes, gdbserver-based remote debugging is often simpler than editing pod security contexts. If you’re weighing container runtimes, Podman’s rootless setup handles ptrace in a different way. See our Podman vs Docker comparison
for a full breakdown of the security and capability trade-offs.
Valgrind Integration
Valgrind Memcheck spots memory leaks that never crash: the quiet bugs that eat memory over time. You can pair it with GDB for live debugging:
valgrind --vgdb=yes --vgdb-error=0 ./myprogramThen hook GDB up to Valgrind’s built-in gdbserver. When Memcheck spots an error, the debugger breaks at that point so you can inspect program state. You can also fire a leak check at any time during the run with the monitor command:
(gdb) monitor leak_check full reachable anyValgrind sorts leaks into four buckets. “Definitely lost” means no pointer to the block is left. “Indirectly lost” means lost because you lost the pointer to a parent struct. “Possibly lost” is unclear. “Still reachable” means not freed, but a pointer still exists at exit.
Debugging Optimized Builds
When a release build crashes in production and you can’t redo it in a debug build, you’ll face optimized code. Variables live in registers, or the compiler has wiped them out:
(gdb) info registers
(lldb) register read
(gdb) disassemble
Reading assembly is the only way here. DWARF split debug info (-gsplit-dwarf flag) lets you keep debug symbols out of the deployed binary. You ship a smaller binary and load the symbols in the debugger when you need them.
GDB vs LLDB Quick Reference
For anyone bouncing between the two debuggers, here are the key gaps in one table:
| Action | GDB | LLDB |
|---|---|---|
| Run program | run | run |
| Set breakpoint | break func | b func |
| Conditional break | break func if x>5 | b func -c 'x>5' |
| Print variable | print var | p var |
| Examine memory | x/16xb addr | memory read -c 16 addr |
| Backtrace | bt | bt |
| List threads | info threads | thread list |
| Watchpoint | watch var | w s v var |
| Step over | next | next |
| Step into | step | step |
| Step out | finish | finish |
| Continue | continue | continue |
Most core commands like bt, next, step, and continue are the same in both tools. The biggest gaps show up in memory-read syntax and breakpoint flags.
If you’re just starting out, focus on break, bt, print, and next. Those four commands cover most debug sessions. Add watchpoints when you need them. Learn the memory-read syntax when you’re chasing buffer issues. Pick up scripting when you find yourself typing the same commands over and over. The official LLDB GDB-to-LLDB command map
is worth a bookmark if you bounce between the two debuggers a lot.