Home Assistant Energy Dashboard: 4 Flows, Solar, and Battery Tracking

The Home Assistant Energy Dashboard gives you a single view of where your electricity comes from, where it goes, and how much it costs. If you have solar panels and a battery, this is the best way to track production, storage cycles, grid exchange, and individual device consumption - all without relying on your inverter manufacturer’s cloud app.
Setting it up takes some care, though. The dashboard expects specific sensor types with specific attributes, and getting those wrong means either blank graphs or wildly inaccurate numbers. Below: the sensor requirements, how to connect popular inverter and battery brands, the actual dashboard configuration, and some custom sensors for deeper insight into your solar investment.
What the Energy Dashboard Needs From Your Sensors
The Energy Dashboard is picky about its inputs. It works exclusively with energy sensors - cumulative counters measured in kilowatt-hours (kWh) with device_class: energy and state_class: total_increasing. It will not accept power sensors (Watts) directly. If your hardware only reports instantaneous power, you need to convert those readings using a Riemann Sum Integral
helper before the dashboard can use them.
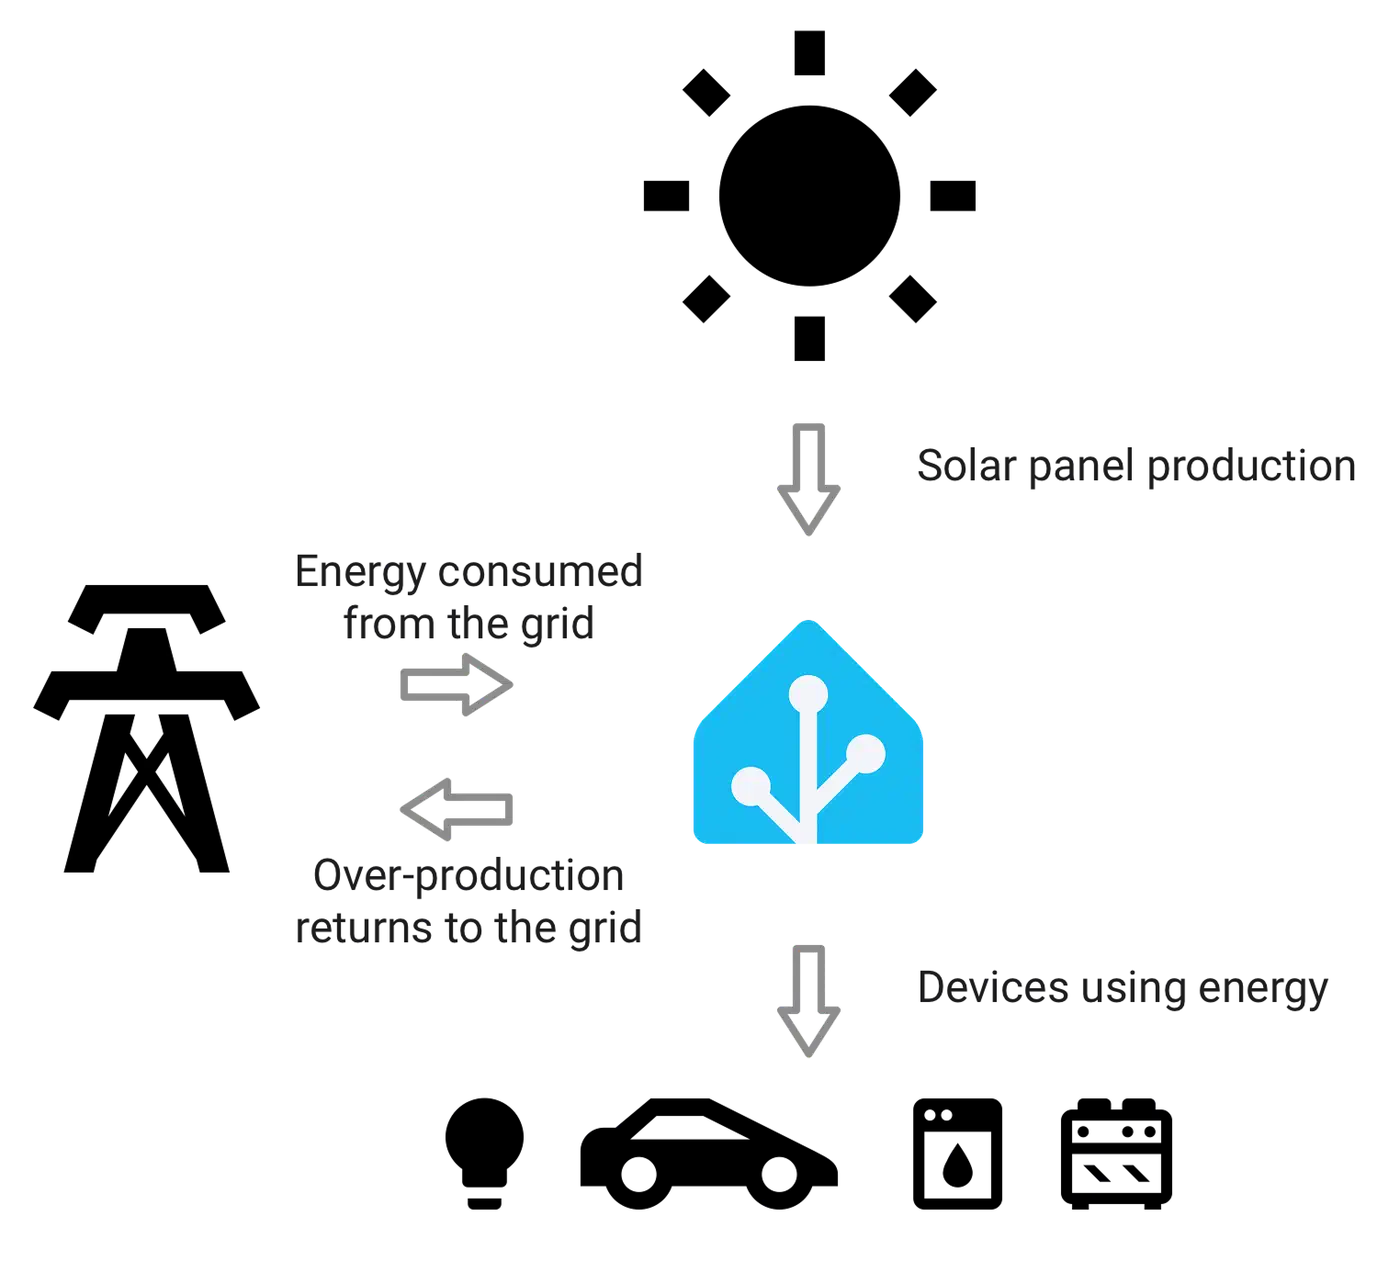
The dashboard tracks four distinct energy flows:
| Flow | What It Measures | Sensor Requirements |
|---|---|---|
| Grid Consumption | Energy imported from your utility | kWh, total_increasing |
| Grid Return | Energy exported/sold back to grid | kWh, total_increasing |
| Solar Production | Total energy generated by panels | kWh, total_increasing |
| Battery In/Out | Energy charged and discharged | Two separate kWh sensors |
Grid sensors require two separate entities: one for import (energy you buy) and one for export (energy you sell back). Most smart meters and CT clamps provide these as distinct sensors. If your meter only reports net flow, you’ll need a template sensor to split positive values (import) from negative values (export).
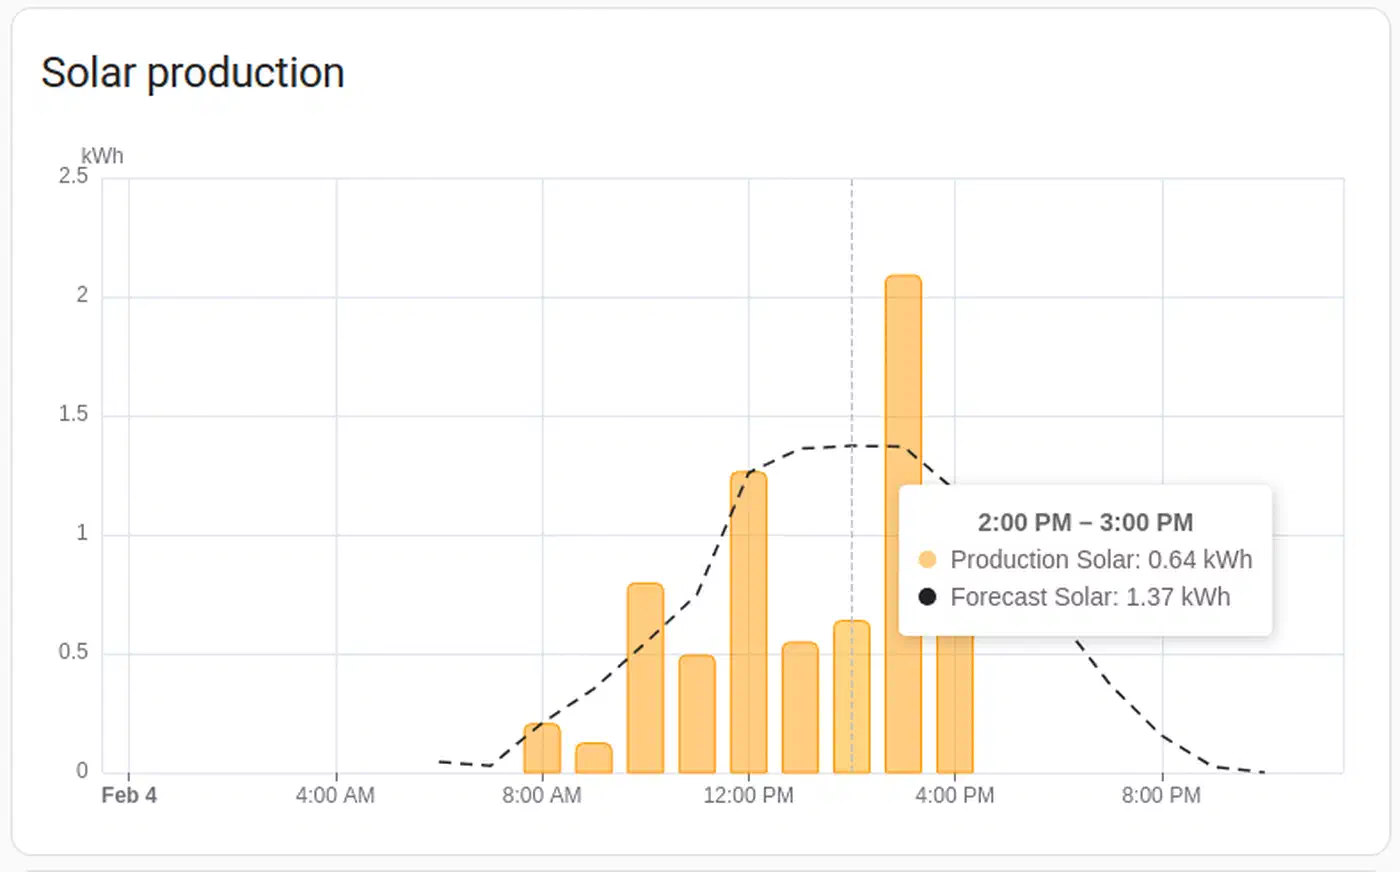
Solar production needs a single cumulative kWh counter from your inverter showing total energy produced. Nearly every solar inverter integration provides this out of the box.
Battery sensors need two separate cumulative counters: energy charged in (kWh) and energy discharged out (kWh). Battery state of charge (SOC, 0-100%) is useful for real-time monitoring on your main dashboard but is not required by the Energy Dashboard itself.
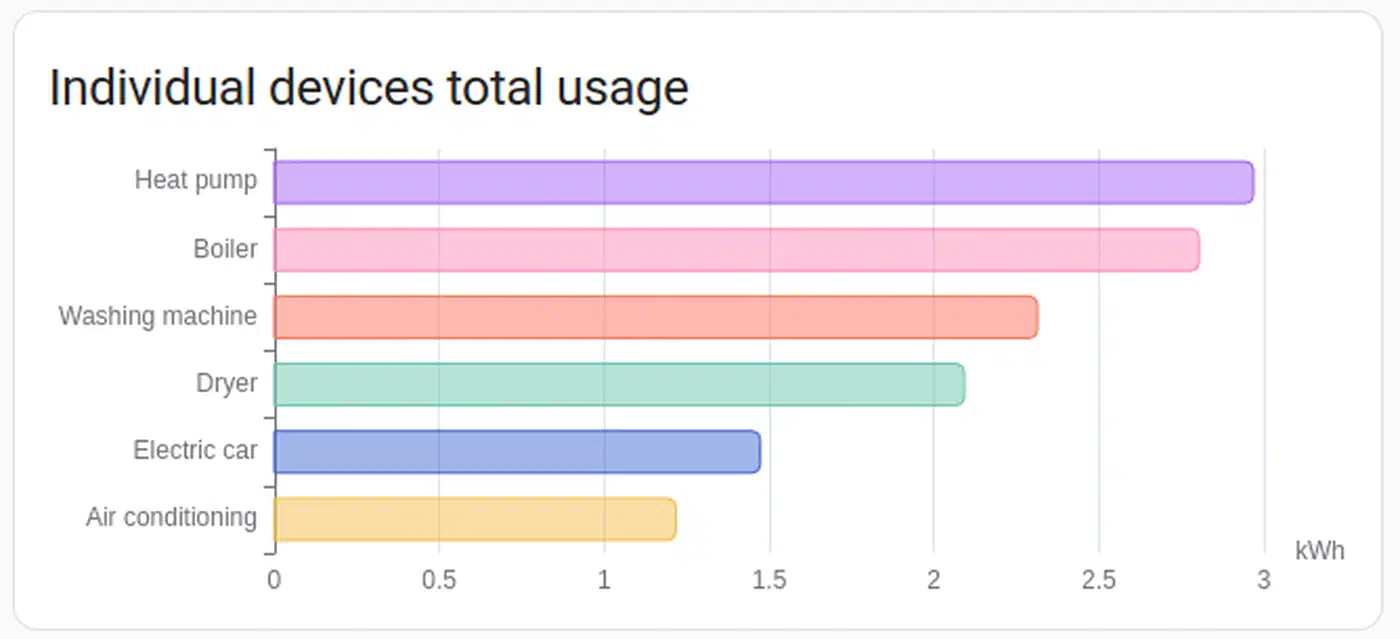
You can optionally track individual devices too. Add energy sensors from smart plugs like the Shelly Plug S or Zigbee plugs with energy monitoring to see which devices consume the most. The dashboard has a dedicated “Individual Devices” section that breaks this down as a pie chart.
Connecting Solar Inverters to Home Assistant
Your inverter is the primary data source for production tracking. The integration path depends on your brand, and the differences between cloud-based and local connections matter more than you might expect.
Enphase Envoy
The native Enphase Envoy integration auto-discovers the Envoy gateway on your local network. It provides per-panel production, total production, grid consumption (if CT clamps are installed on your Envoy), and battery data for IQ Battery systems. The integration polls the Envoy’s local REST API every 60 seconds by default. For firmware 7.x and later, you’ll need your Enphase account credentials during setup - Home Assistant uses these to obtain the authentication token needed for local API access. The token is valid for one year and auto-renews one month before expiration.
SolarEdge
SolarEdge
offers two integration paths. The cloud-based SolarEdge integration uses your API key from the SolarEdge monitoring portal and provides inverter production, lifetime energy, and power flow data. The drawback: it’s cloud-dependent with a 15-minute update delay and a limit of 300 API calls per day.
The better option for most users is the SolarEdge Modbus Multi custom integration (available through HACS). This connects locally to your inverter over Modbus TCP, giving you updates as fast as every second with zero cloud dependency. To enable it, you need to activate Modbus TCP on the inverter via the installer menu (SetApp or LCD panel), then point the integration at the inverter’s local IP address on port 1502. One caveat: SolarEdge inverters only allow one Modbus TCP connection at a time, so you may need to disable SolarEdge’s own monitoring connection.
Fronius
The Fronius integration connects locally to the Fronius Datamanager via its HTTP API. It provides PV production, grid import/export, and battery data for Fronius/BYD hybrid systems. Update rates are fast - sub-second in some configurations.
SMA
The SMA Solar integration communicates via SMA’s Speedwire protocol over your local network. It covers inverter production, grid meter readings (if an SMA Energy Meter or Home Manager 2 is installed), and battery data for SMA Storage systems.
Generic Option for Other Inverters
If your inverter brand lacks a native integration, a Shelly EM with a CT clamp on the solar circuit breaker can measure production independently. The Shelly EM Gen3 runs around $45, connects over local Wi-Fi with no cloud dependency, and its native Home Assistant integration exposes power, voltage, current, and cumulative energy sensors right out of the box. For the cost, it’s hard to beat as a vendor-agnostic solar monitor. For a broader look at per-circuit energy monitoring with CT clamps across your whole home, see tracking your home’s energy usage with Home Assistant .
Integrating Battery Storage Systems
Battery systems make energy flow tracking more complex but they’re the key to understanding self-consumption and grid independence.
Tesla Powerwall
The Tesla Powerwall integration connects locally to the Powerwall Gateway (TEG) via local polling. It provides battery SOC, charge/discharge power, grid import/export, solar production, and home consumption - one integration that covers nearly every sensor the Energy Dashboard needs. Note that the local API is read-only; Tesla removed control functions from the local gateway, so if you want to change operating modes or backup reserve levels, you’ll need a cloud-based solution like Teslemetry as a bridge to Tesla’s Fleet API.
Enphase IQ Battery
If you have Enphase batteries, the data comes through the same Enphase Envoy integration used for solar. The Envoy reports battery SOC, charge/discharge energy, and the system’s operating mode (self-consumption, backup, time-of-use). No additional integration needed.
SonnenBatterie
The SonnenBatterie custom integration (available through HACS) connects to the battery’s local API (port 80 on the Sonnen unit). It provides SOC, charge/discharge power, production, consumption, and grid flow - all from one device.
DIY and Hybrid Systems
For off-grid or hybrid inverter/chargers like EG4, Sol-Ark, or Victron, you typically connect via Modbus TCP/RTU to read registers directly from the inverter. Victron
systems can use the dedicated Victron integration or venus-mqtt for data via MQTT from a Cerbo GX controller.
Converting Power to Energy
If your battery integration only provides instantaneous power (Watts) rather than cumulative energy (kWh), you need the Riemann Sum Integral helper. Go to Settings > Devices & Services > Helpers, create a new Integration (Riemann Sum) helper, select the power sensor as the source, and choose the trapezoidal method. This is the most accurate method when the source sensor updates frequently. The helper creates a new kWh sensor you can assign in the Energy Dashboard.
A practical addition outside the Energy Dashboard: add a gauge card to your main dashboard showing battery SOC with color zones - green (60-100%), yellow (20-60%), red (0-20%) - for quick at-a-glance storage status.
Configuring the Dashboard Step by Step
With all your sensors connected and reporting, here’s how to wire them into the Energy Dashboard.
Start by navigating to Settings > Dashboards > Energy, or open the Energy panel from the sidebar and click “Configure.”
For grid consumption, select your grid import sensor (must be kWh with total_increasing state class). If your utility charges different rates by time of day, you can add a cost entity - either a template sensor returning your current rate in $/kWh, or use the built-in “Use a static price” option for flat-rate plans.
Grid return is next: select your grid export sensor and set your feed-in tariff rate. This lets the dashboard calculate revenue from exported solar energy, whether you’re on net metering or a feed-in tariff arrangement.
Under solar panels, select your production sensor. If you run multiple inverters or separate strings, add each one individually - the dashboard sums them automatically. You can assign a cost entity representing the value of solar production at your avoided grid rate.
For the home battery section, add the charge sensor and discharge sensor as separate entities. The dashboard calculates net battery flow and shows charge/discharge periods on the daily graph.
Individual devices are optional but worth adding for your major loads - HVAC, EV charger, dryer, water heater. The dashboard renders each device’s share of total consumption as a pie chart, which is useful for spotting the appliances that silently drain the most energy.
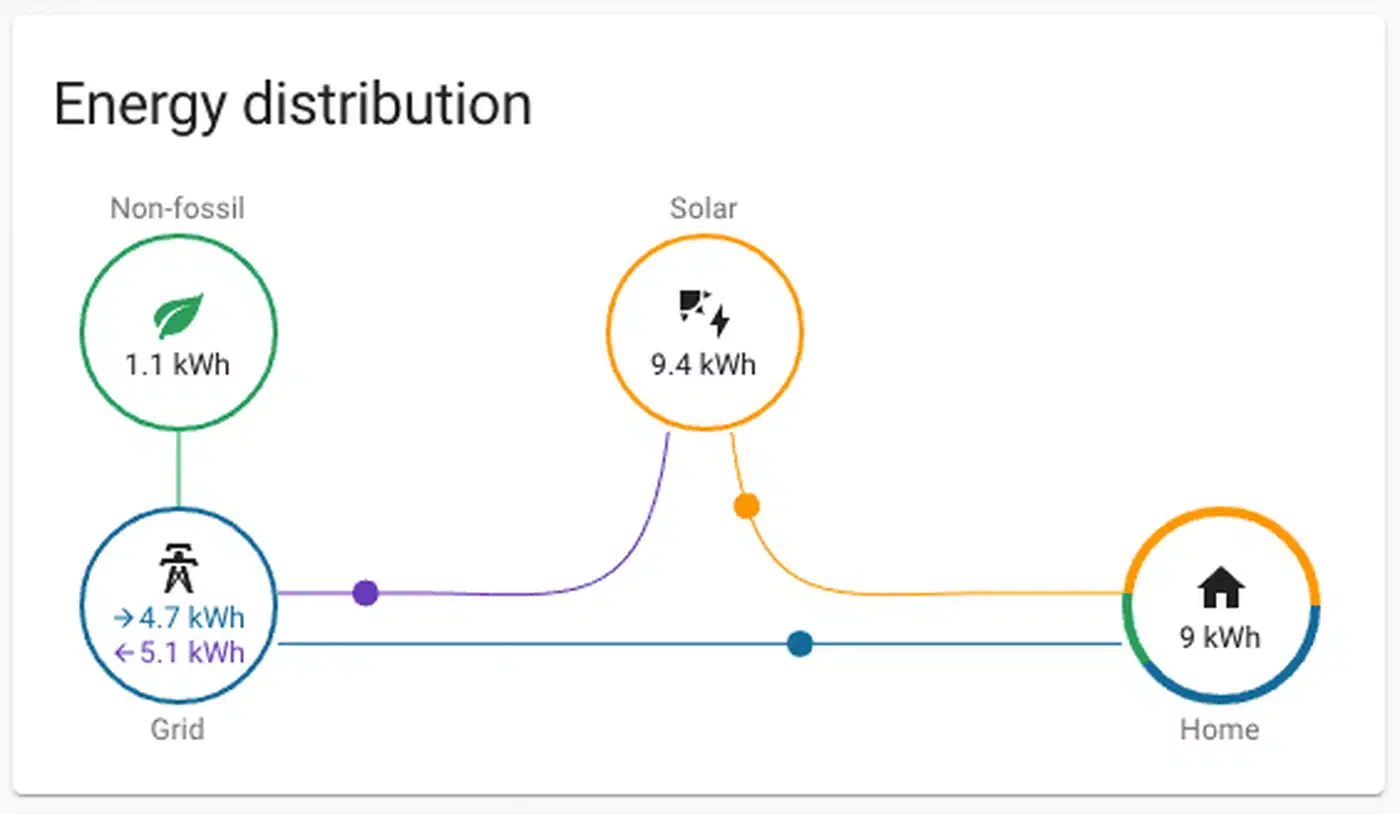
After saving, give it 1-2 hours for data to accumulate. Check that the “Energy Distribution” flow diagram shows arrows pointing in the right directions: solar flows to home and battery, battery flows to home and grid, grid flows to home. If arrows are reversed or missing, you likely have a sensor assigned to the wrong category or a sensor that’s reporting negative values.
Advanced Analysis With Custom Sensors
The Energy Dashboard shows the basics well, but custom template sensors and utility meters push your analysis further.
Self-Consumption Ratio
This tells you what percentage of your solar energy you use directly rather than exporting to the grid. Higher is better for maximizing your investment. Create a template sensor:
template:
  - sensor:
      - name: "Solar Self-Consumption Ratio"
        unit_of_measurement: "%"
        state: >
          {% set production = states('sensor.solar_production_daily') | float(0) %}
          {% set export = states('sensor.grid_export_daily') | float(0) %}
          {% if production > 0 %}
            {{ ((production - export) / production * 100) | round(1) }}
          {% else %}
            0
          {% endif %}
Grid Independence Ratio
Shows what percentage of your total energy consumption comes from solar and battery rather than the grid:
template:
  - sensor:
      - name: "Grid Independence"
        unit_of_measurement: "%"
        state: >
          {% set consumption = states('sensor.home_consumption_daily') | float(0) %}
          {% set grid_import = states('sensor.grid_import_daily') | float(0) %}
          {% if consumption > 0 %}
            {{ ((consumption - grid_import) / consumption * 100) | round(1) }}
          {% else %}
            0
          {% endif %}
Monthly ROI Tracking
Use Utility Meter
helpers with a monthly cycle to track solar production and grid export over billing periods. Configure them under Settings > Devices & Services > Helpers by selecting “Utility Meter,” pointing it at your solar production or grid export sensor, and setting the cycle to monthly. Multiply the monthly production by your avoided electricity rate and the monthly export by your feed-in tariff to calculate savings. Track cumulative savings against your system’s total cost to see your payback timeline. If these template sensors and meters are growing your configuration significantly, the Home Assistant packages system
lets you organize them into self-contained files grouped by feature.
Peak Production Monitoring
Use statistics template sensors with stat_type: max to log daily peak solar production and peak home consumption. Comparing peak production against your system’s rated capacity tells you whether your panels are performing at their potential or if shading, soiling, or degradation is cutting into output.
Time-of-Use Battery Optimization
If your utility charges different rates for peak and off-peak hours, you can automate battery behavior. Create automations that charge the battery from the grid during off-peak hours and discharge during peak, using your battery integration’s operating mode control. This works particularly well with the Tesla Powerwall (via Teslemetry) and Enphase IQ systems that expose operating mode switches. For logic that goes beyond HA’s native automation editor, AppDaemon lets you write time-of-use charging schedules as Python classes with full access to battery state history.
Excess Solar Alerts
Set up a notification that fires when solar production exceeds home consumption by more than 2 kW and the battery is full (SOC above 95%). This is the ideal moment to start high-energy tasks - run the dishwasher, throw in a load of laundry, or plug in the EV. You’re generating power that would otherwise be exported at a lower feed-in rate.
Troubleshooting Common Issues
A few problems come up repeatedly when setting up the Energy Dashboard.
“Statistics not available” errors: This usually means the sensor is missing the correct device_class or state_class attributes. Check under Developer Tools > States that your sensor has device_class: energy, state_class: total_increasing, and a unit of kWh. If you created a Riemann Sum helper and it’s showing the wrong device class, you may need to manually override it with a customize entry
in your configuration.yaml.
Negative energy values: This happens when a sensor that should be total_increasing resets or decreases. Common causes include inverters that reset their daily counter at midnight or sensors that briefly report 0 during communication errors. The Energy Dashboard expects monotonically increasing values; any decrease gets interpreted as a meter reset. If your sensor resets daily, consider using a Utility Meter helper to create a proper cumulative counter.
Incorrect statistics: If bad data has already been recorded, go to Developer Tools > Statistics to find and remove corrupted readings. This is the only way to fix historical data that’s throwing off your graphs.
Missing data gaps: If the dashboard shows gaps, your sensor likely went unavailable. Check your integration’s polling interval and your device’s network reliability. For Wi-Fi devices like Shelly, a stable connection matters - interference or weak signal strength can cause intermittent dropouts that show up as missing bars in the energy graphs.
Carbon Tracking and Beyond
The Electricity Maps integration (formerly CO2Signal) adds carbon intensity data to your Energy Dashboard. It queries the Electricity Maps API for your region’s current grid carbon intensity in gCO2eq/kWh and shows what percentage of your local grid relies on fossil fuels. The Energy Dashboard uses this automatically to calculate your home’s carbon footprint based on actual grid import. The free tier supports one zone with up to 50 API requests per hour.
For users who want analysis beyond what Home Assistant’s built-in charts offer, exporting energy data to InfluxDB and visualizing with Grafana opens up time-series analysis with arbitrary query complexity, custom aggregation windows, and dashboards that can overlay weather data, electricity prices, and production forecasts on the same timeline.
Once everything is configured and data starts flowing, the Energy Dashboard replaces guesswork with actual numbers. You can see exactly how much solar you produced, how much you stored, how much you pulled from the grid, and what all of that cost - on any given day, week, or month. That kind of visibility changes how you think about running your home.