 Botmonster Tech
GeoLibre maps Earth, the Moon, and Mars in a browser
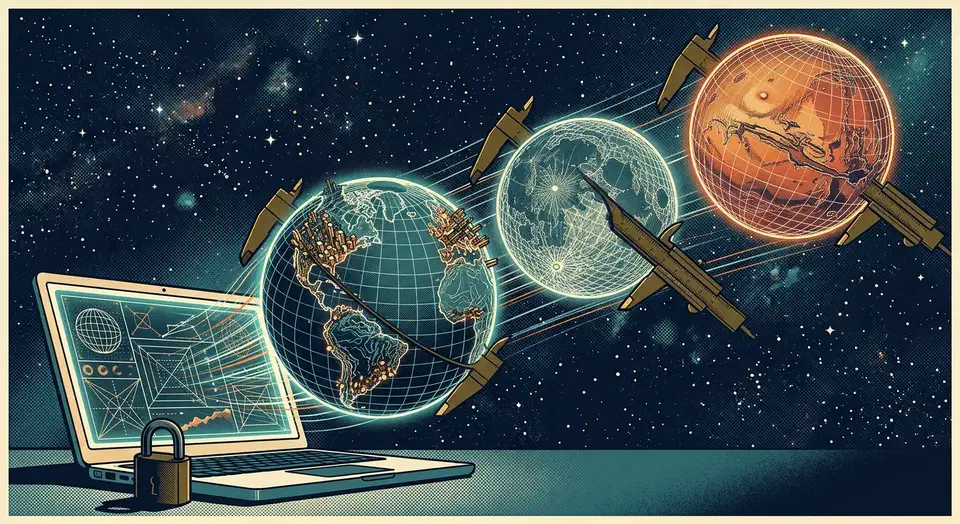
GeoLibre is an open source GIS in the browser, and the trick behind it is DuckDB compiled to WebAssembly. Spatial queries run inside your tab, so nothing gets uploaded. The same codebase also ships as a desktop app, an Android app, and a Jupyter widget. It maps the Moon and Mars as well as Earth.
Key Takeaways
- GeoLibre runs a real GIS in a browser tab with nothing to install.
- Your data stays on your machine, because the analysis runs in the page.
- The same app installs on desktop, on Android, and inside Jupyter notebooks.
- It maps the Moon, Mars, and Pluto, with measurements matched to each body.
- Big files still choke a browser tab, so the desktop build exists for those.
What an open source GIS in the browser can do
QGIS users tend to assume a browser GIS is a viewer with a few buttons and no teeth. GeoLibre opens at web.geolibre.app with no install and no account, and the map workspace is the whole app.
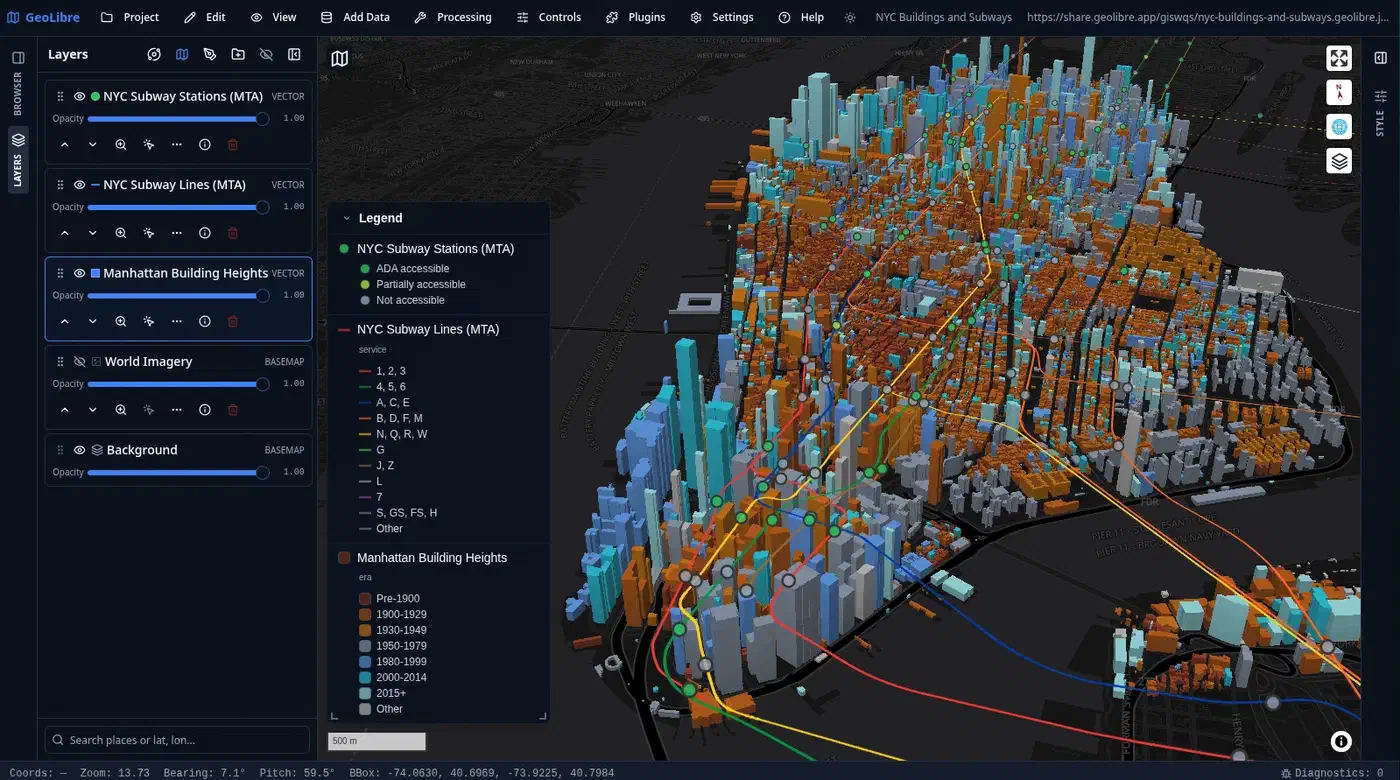
Production web maps are built on this same rendering stack. MapLibre GL JS draws the map, deck.gl handles large overlays and point clouds, and 3D Tiles load as a normal layer type. An optional CesiumJS globe can share the workspace as a split pane.
The Manhattan demo shows the ceiling. Building footprints are extruded in 3D and coloured by construction era, with MTA subway lines and stations on top. The legend builds itself from the layers’ own symbology. A time slider then animates the dataset from 1850 to 2025, so the city fills in year by year.
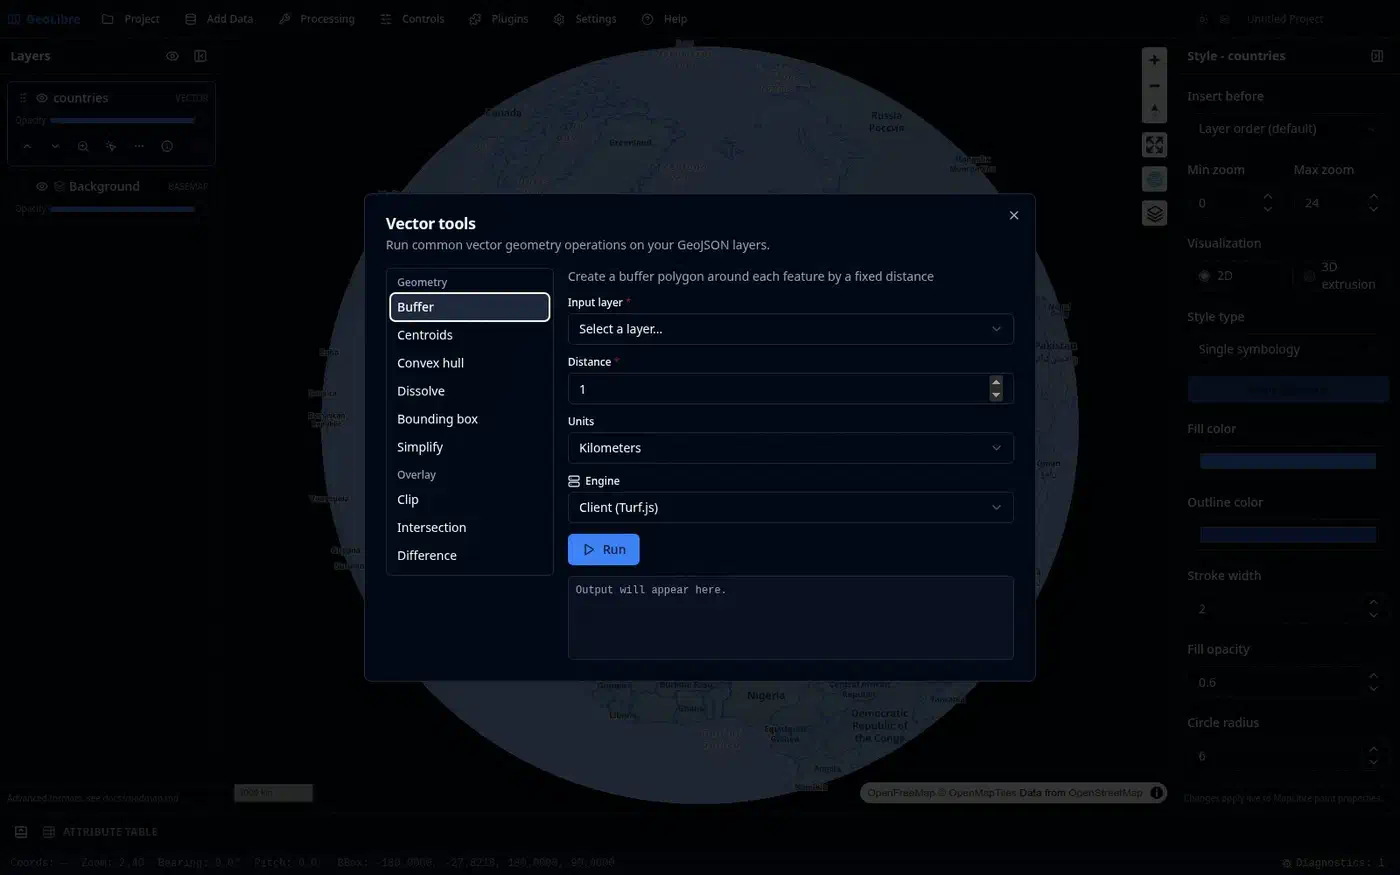
The Whitebox toolbox runs in the browser through a WebAssembly runtime instead of a Python server, drawing on the geolibre-rust package. That package is a superset of the 733-tool whitebox-wasm suite, plus GeoLibre’s own additions. None of it needs a server, GDAL, or a native install.
Finished maps go to the project’s share service and come back as a link you can send. A plugin site extends the app, and every release is archived with a citable DOI.
The same app on desktop, phone, and in Jupyter
One codebase, wrapped by Tauri version 2, becomes a native app on every platform people use for real work, which is the practical reason to pick GeoLibre over a web-only tool.
Desktop builds cover Windows, macOS, and Linux, and they are small. The Windows installer is about 36 MB and the Apple silicon disk image about 38 MB. You can get them from the downloads page, the Microsoft Store, the Arch user repository, or Flatpak.
A native Android app on Google Play is rare for GIS software. The Android build ships the whole map workspace, the vector tools, the SQL workspace, and the Python console. Tools that need a local Python helper process are hidden on mobile, so they never appear and then fail. That covers the Whitebox batch runner and the raster tools.
The notebook path is just as complete. The geolibre package on PyPI embeds the full app in a Jupyter cell as an anywidget, with a leafmap-style API. State syncs both ways through one project file. Layers you add from Python show up in the UI, and edits you make by hand read back into Python. A Colab notebook is the fastest way to try it.
| Tool | Where it runs | Install size | Data location |
|---|---|---|---|
| GeoLibre | Browser, desktop, Android, Jupyter | ~36 MB desktop, or nothing | Your machine by default |
| QGIS | Desktop only | Over a gigabyte | Your machine |
| ArcGIS Online | Browser | Nothing | Esri’s servers |
| leafmap | Jupyter only | Python package | Your machine |
Local data and in-browser SQL
GeoLibre loads DuckDB compiled to WebAssembly, with the spatial extension, straight into the page. Filtering, joining, and aggregating then happen in the tab, so there is no upload and no server round trip. The data stays private, but your connection is a separate story: every request still carries your IP and a rough location, which you can check by reading your own IP from a small Cloudflare Worker.
That changes who can use the tool at all. Anyone whose data cannot legally leave their machine, whether health, defence, survey, or commercial, can open a real GIS without a compliance conversation. It also covers everyone with no budget and no server, which describes most of the education and non-profit world. Keeping the work in the tab also keeps it reachable: an agent driving the page through browser-side tools like WebMCP never has to see the data leave either.
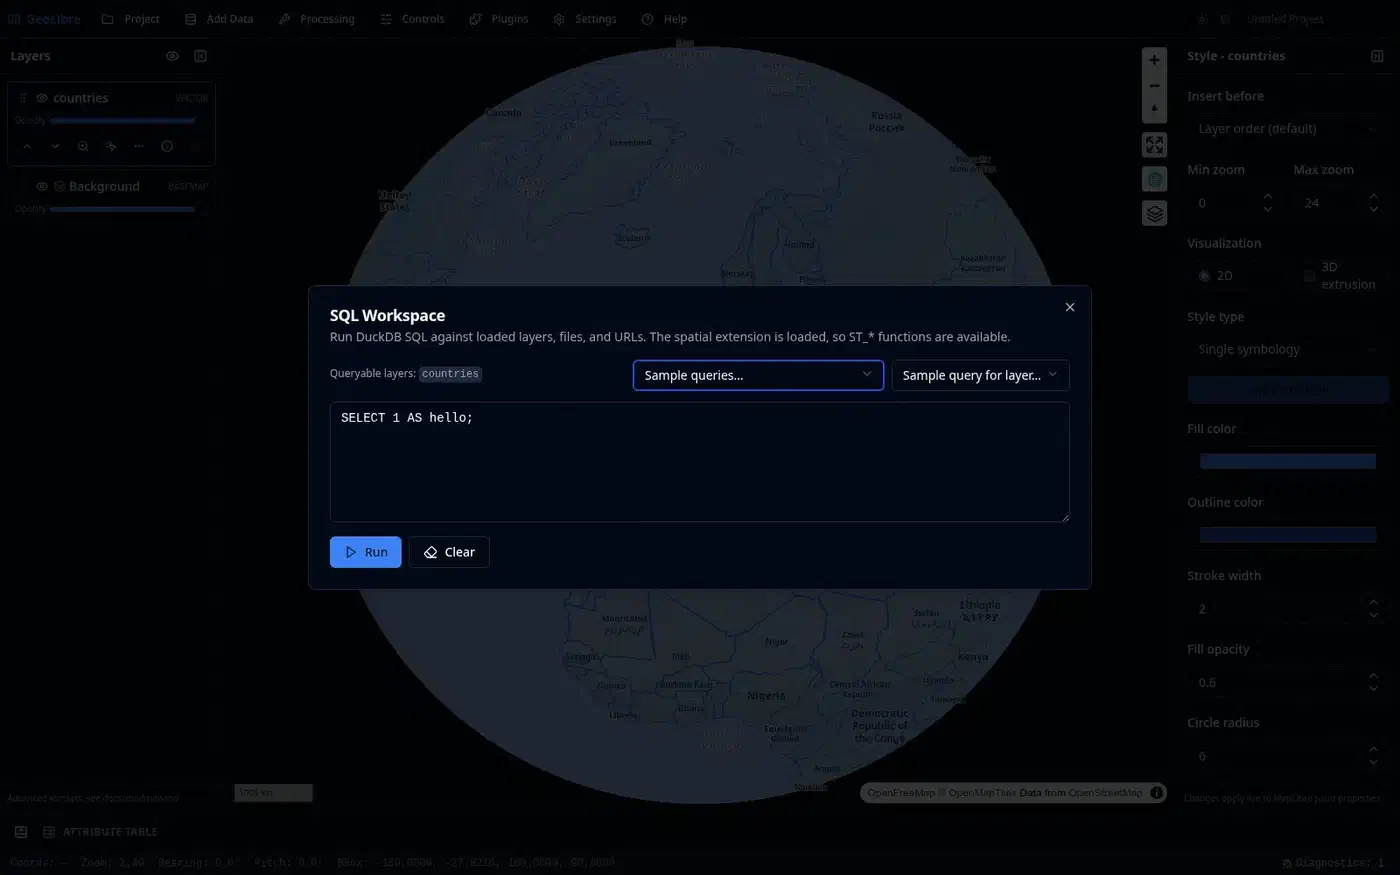
The SQL Workspace goes further than one engine. DuckDB is the default and works offline after the first run. PostGIS runs in-browser through PGlite behind a roughly 19 MB download, and Apache Sedona runs on a WebAssembly build of SedonaDB. All three load a spatial extension, so ST_* functions work in each.
Browser memory is the ceiling, though. One commenter on the Hacker News thread for the 1.0 release found where it breaks:
The desktop version worked a little better and could render some smaller files (~30mb geopackage, 300kb SHP.zip). Trying to load some bigger files >1gb kind of just sat on ‘Importing data…’ for a while, then the screen went blank and I lost all my layers.
The app does warn before loading very large files, and it tiles big vector layers client-side. Past a gigabyte, use the desktop build.
Sharing carries one caveat. Project > Share uploads the project file to share.geolibre.app. Layers that exist only in memory or in a local file get embedded in that file behind a size cap. Local-first is a default you can override by accident.
QGIS users get one more practical win. Vector styling imports and exports as OGC SLD, QGIS QML, and Mapbox GL style JSON, so symbology round-trips between the two apps. GeoLibre still will not replace a heavy QGIS processing pipeline, but it is the fastest path from a file to a shareable interactive map.
I’m a big fan of QGIS, but doing stuff browser side is just terribly convenient
Mapping other planets, and the ellipsoid detail behind it
Planetary basemaps come from OpenPlanetaryMap and USGS Astrogeology. They cover the Moon, Mars, Mercury, Venus, the Galilean moons Io, Europa, Ganymede, and Callisto, plus Titan, Pluto, and Charon.
Each project carries its own ellipsoid, the mathematical shape of the body beng mapped. Distance, area, and scale are then calculated against that shape instead of Earth’s.
Measuring a Martian crater with Earth’s ellipsoid gives you a number that is wrong and looks completely right. A team that handles obscure planetary radii carefully is probably handling Earth projections carefully too.
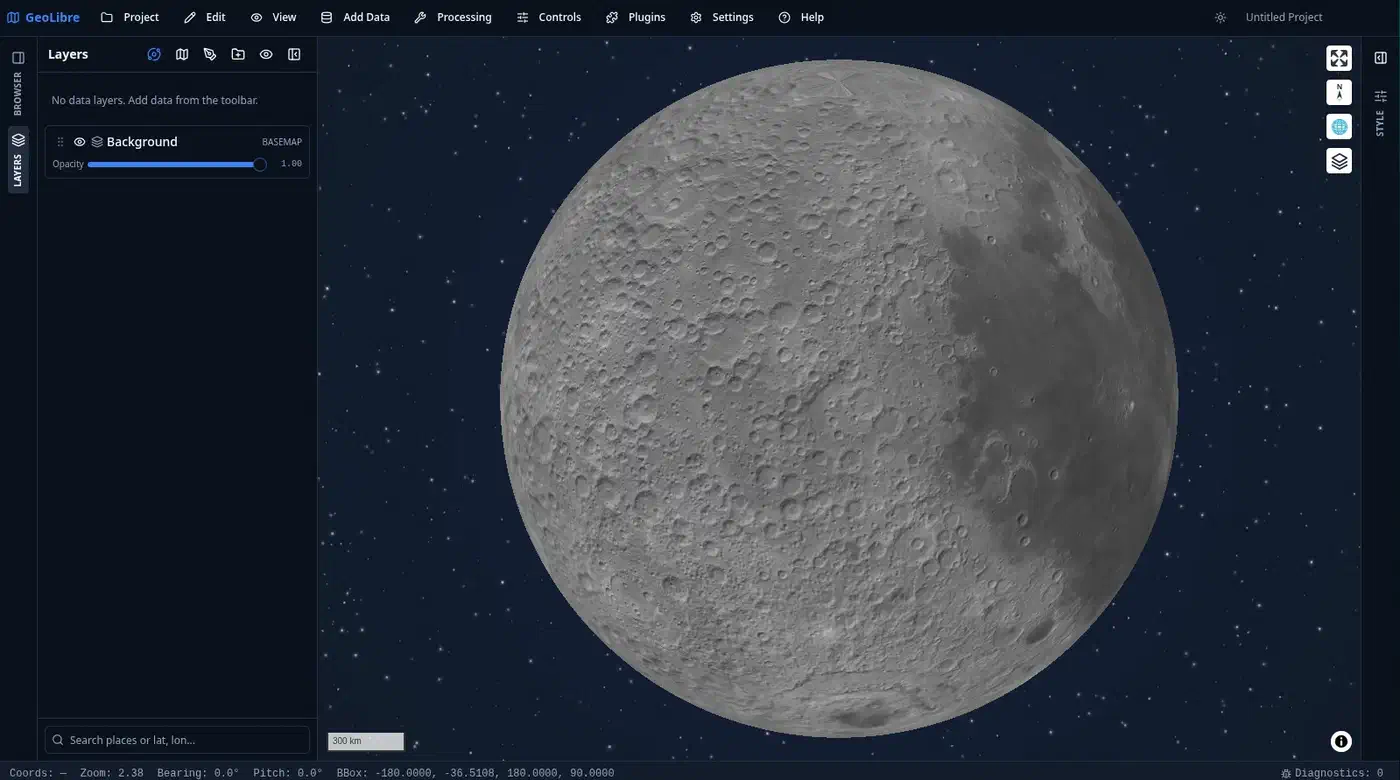
Most people notice the deep-space starfield behind each globe first. It comes from the Atmosphere Effects plugin, which is not part of the core app. Switch bodies from the planet switcher in the Layers panel.
To test the ellipsoid claim yourself, open the web version, switch the basemap to the Moon, and measure something.
Who is behind it
GeoLibre comes out of opengeos, the open geospatial group behind leafmap and geemap. Its lead, Qiusheng Wu, wrote the Python mapping libraries much of the research world already runs on. So the Jupyter side feels finished rather than bolted on.
The project also moves fast. Version 2.4.0 alone drew roughly 1,300 installer downloads, unusual pull for software most people can use without downloading anything.