 Botmonster Tech
Debug 90% of Linux network faults with three commands


Debug Linux network issues with three tools: ss for socket state, nft for firewall rules, and tcpdump for what is really on the wire. This trio replaces the old netstat, iptables, and ifconfig workflow, and it ships by default on modern distros. Learn all three and you can fix 90% of connection faults in minutes.
Stop using deprecated tools
Many sysadmins still reach for ifconfig, netstat, and iptables out of habit. Most of them no longer ship by default. The rest are thin shims that sit on top of their modern replacements. Here is the mapping:
| Old Command | Modern Replacement | Why Switch |
|---|---|---|
ifconfig | ip addr / ip link | ifconfig cannot handle network namespaces, VLANs, or bonding. Not installed by default since ~2020 on most distros. |
netstat | ss | ss reads directly from kernel netlink sockets and is 10-100x faster on servers with thousands of connections. |
iptables | nft (nftables
) | iptables is a compatibility layer on top of nftables since kernel 5.x. nftables has cleaner syntax, better performance, and native set/map support. |
route | ip route | Part of the deprecated net-tools package. |
One tool has not changed. tcpdump
4.99.6 is still the standard for packet capture. Wireshark
’s CLI tool tshark is the pick when you need to dig into a protocol.
Each tool covers one layer: ss reports what is listening and connected, nft shows what the firewall allows or drops, and tcpdump shows the traffic moving on the wire. Work through them in that order.
Check socket state with ss
Before you reach for a packet capture, check that the service is listening and that connections reach it. ss answers both in milliseconds.
To list all listening TCP sockets, run:
ss -tlnpThe flags: -t for TCP, -l for listening only, -n for numeric output (no DNS lookups), -p to show the owning process. That one command tells you if your service is up and bound to the right port.
You can filter by port to check one service. To see if nginx is listening on 443:
ss -tlnp sport = :443Drop the -l flag to see established connections instead of listeners:
ss -tnpThis shows source, destination, and TCP state for every active connection.
To check for connection leaks, count TIME_WAIT sockets:
ss -tn state time-wait | wc -lA big pile of TIME_WAIT sockets usually means an app opens and closes connections too fast instead of reusing them.
To diagnose slow transfers, the -i flag shows TCP internals: congestion window size (cwnd), round-trip time (rtt), and retransmit counts:
ss -tiAdd -o to see connection timers (keepalive, retransmit countdowns, TIME_WAIT expiration):
ss -tnpoIf ss -tlnp does not show your service on the expected port, the fault is in the app. Check its logs and config before you touch anything on the network side.
Inspect and trace firewall rules with nftables
If the service is listening but remote connections fail, the firewall is your next suspect.
Start by listing the full ruleset:
nft list rulesetThis prints every table, chain, and rule in a form you can read. Look for drop or reject rules that match your port and protocol.
To confirm that traffic is actually reaching a specific rule, add counters:
nft add rule inet filter input tcp dport 443 counter acceptThen inspect the chain:
nft list chain inet filter inputIf the counter goes up, traffic reaches that rule. If it stays at zero, something else handles those packets, likely an earlier rule or a different chain.
For more detail, nftables tracing lets you watch every rule each packet hits, live. It usually pins down where a packet gets dropped:
# Add a trace rule to the prerouting chain
nft add rule inet filter prerouting meta nftrace set 1

# Watch the trace output
nft monitor trace

# Remove the trace rule when done (it has performance overhead)
nft delete rule inet filter prerouting handle <N>
The trace output shows the table, chain, rule, and verdict for every packet, so you can see exactly where traffic is accepted, dropped, or forwarded.
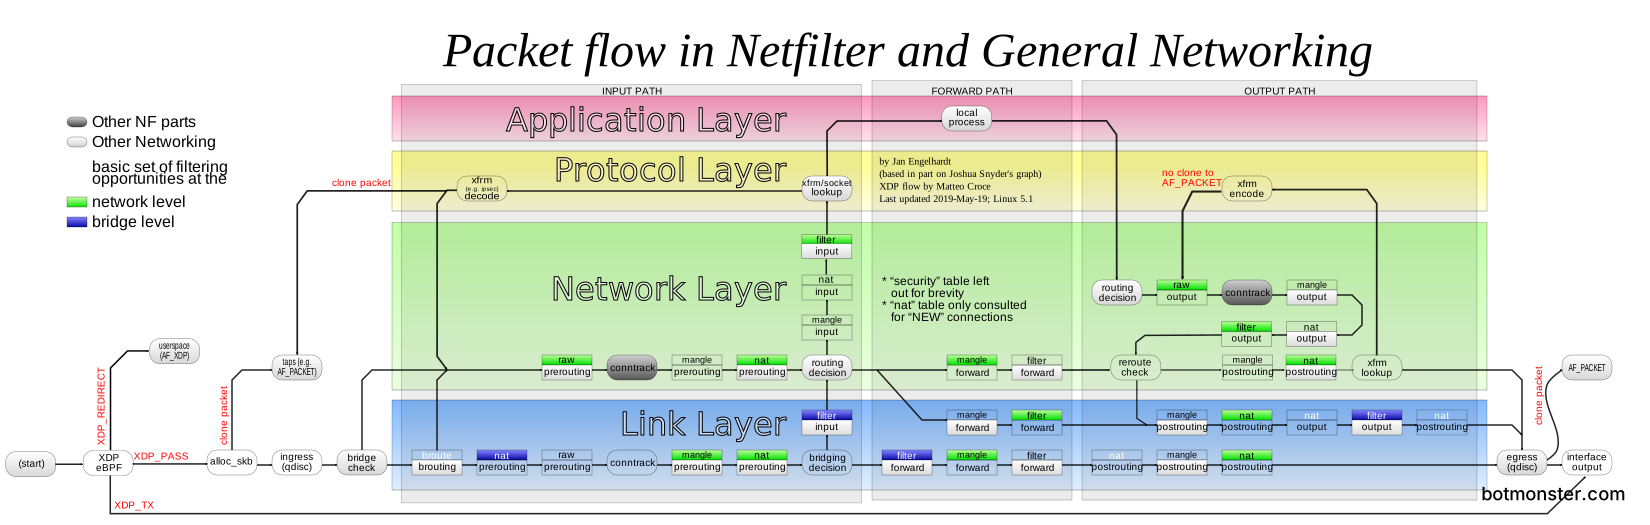
Knowing how packets flow through the kernel’s netfilter layer helps you guess which chain and hook the trace output means. The diagram below shows the full path a packet takes through nftables:
A few common mistakes to check:
- Rules added to the wrong chain (
inputvs.forward). Packets passing through the host, say to Docker containers, hitforward, notinput. - A missing
ct state established,related acceptrule. Reply packets then get dropped, even though the first connection was allowed. - Docker or Podman
adding their own nftables rules that clash with yours. Run
nft list rulesetfor the full picture, rules you never wrote included.
UFW and firewalld both write nftables rules behind the scenes. Do not trust their own view of the firewall. Read the real output of nft list ruleset, because the rules they generate sometimes differ from what they report. To see a full ruleset in action with NAT, DHCP, and traffic shaping, walk through routing and shaping traffic entirely with nftables
.
Capture and analyze packets with tcpdump
When socket state and firewall rules both look fine but traffic still fails, a packet capture shows what is really on the wire.
A basic capture on port 443 looks like this:
sudo tcpdump -i eth0 -nn port 443The -nn flag skips both DNS and service name lookups, which speeds up the output a lot.
To save a capture for later analysis in Wireshark, write to a .pcap file:
sudo tcpdump -i eth0 -w /tmp/capture.pcap port 443You can narrow the capture to specific hosts:
sudo tcpdump -i eth0 host 192.168.1.50 and port 22To see packet contents as ASCII (useful for plain HTTP debugging), add -A. For hex output, use -X instead:
sudo tcpdump -i eth0 -A port 80On busy servers, limit what you capture. -s 96 grabs headers only, which is enough for most debugging and keeps files small. -c 100 stops after 100 packets:
sudo tcpdump -i eth0 -s 96 -c 100 port 443To isolate TCP handshakes, filter for SYN and FIN flags:
sudo tcpdump -i eth0 'tcp[tcpflags] & (tcp-syn|tcp-fin) != 0'This shows you whether connections open and close the way they should.
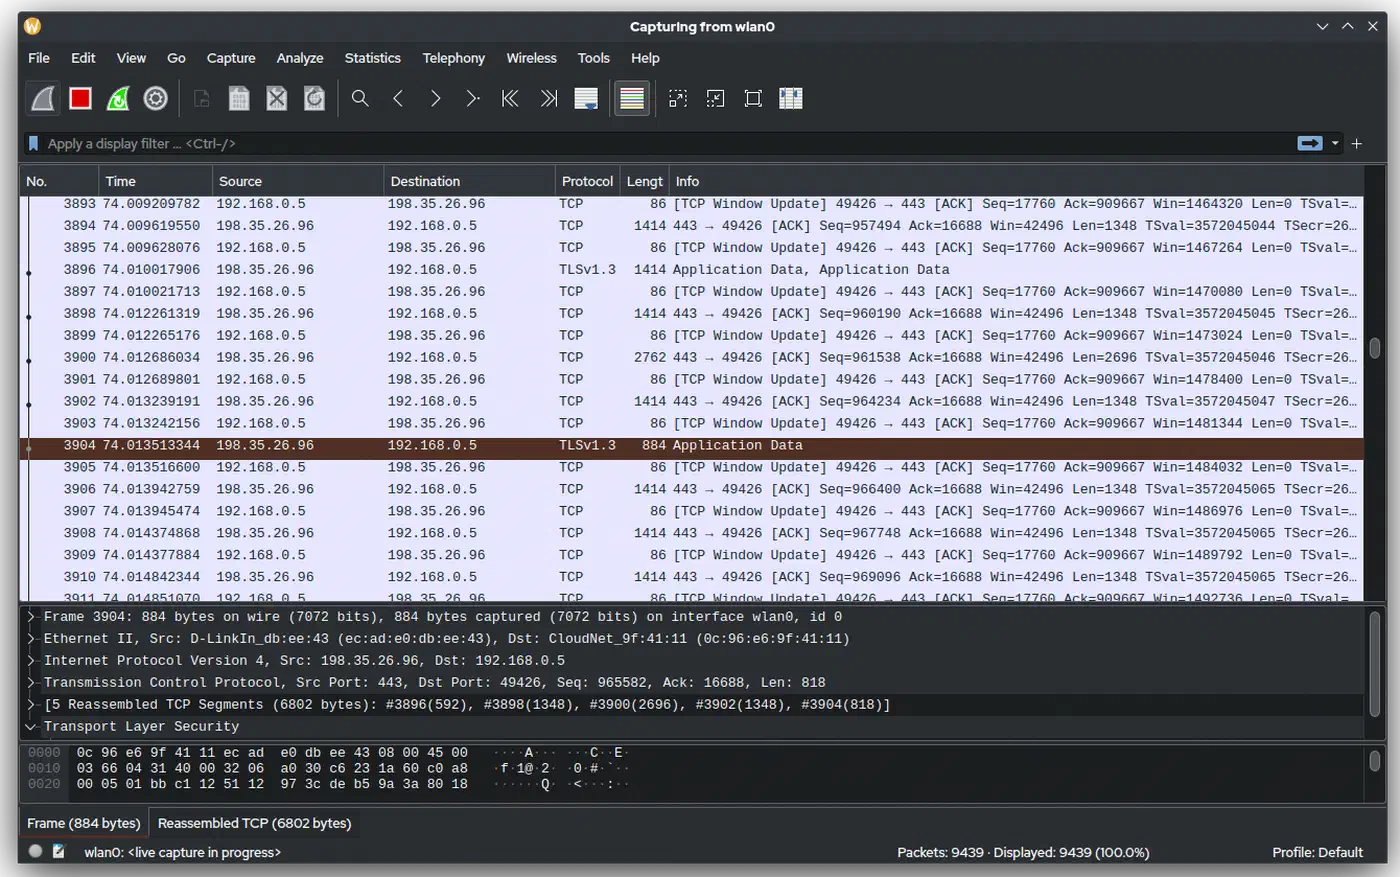
For DNS debugging, capture port 53 traffic to see every query and reply. That exposes slow lookups, NXDOMAIN failures, and queries sent to the wrong resolver:
sudo tcpdump -i eth0 port 53Reading tcpdump output: common patterns
| What You See | What It Means |
|---|---|
| SYN sent, no SYN-ACK returned | Firewall or routing issue between client and server |
| SYN-ACK received, no ACK from client | Client-side firewall is dropping the return traffic |
| RST immediately after SYN-ACK | The service rejected the connection (check application logs) |
| Many retransmissions | Packet loss on the network path |
You can also pipe tcpdump output over SSH straight into Wireshark on your desktop:
ssh server 'tcpdump -ni any -s0 -U -w - port 443' | wireshark -k -i -The -U flag forces packet-buffered output. Packets show up in Wireshark right away instead of waiting for the buffer to fill.
A systematic debugging workflow
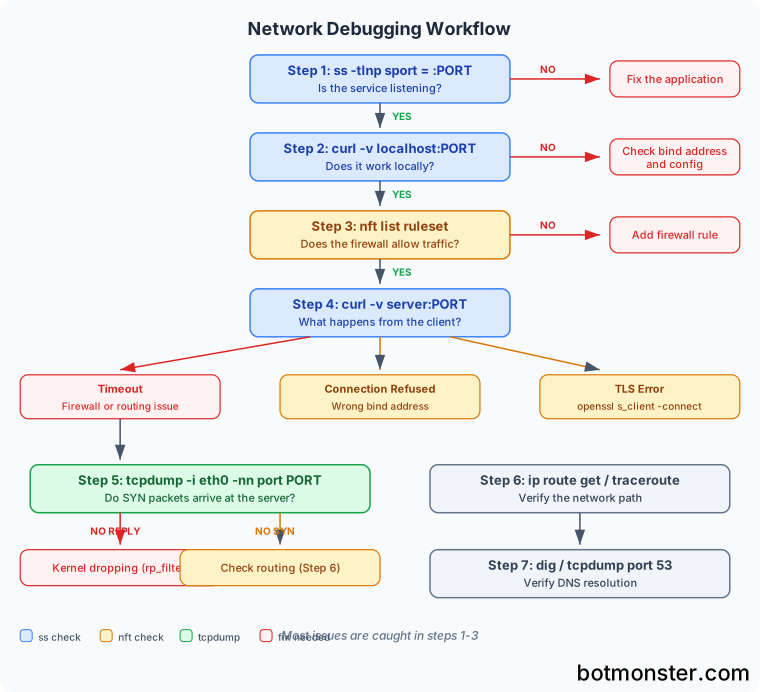
Single tools are useful, but a fixed order saves time. Follow these steps when someone reports “I cannot connect to service X on port Z from host Y”:
- Check the server with
ss -tlnp sport = :Z. If the service is not listening, fix the app first. - Check locally with
curl -v localhost:Zon the server itself. If that fails, the service is set up wrong, usually a bad bind address or a broken config file. - Check the firewall with
nft list ruleset | grep Z. Add a rule for that port if none exists. - Check from the client with
curl -v server:Z, then read the failure:- A timeout points to a firewall or routing fault. Run tcpdump on both ends to see where packets vanish.
- Connection refused means the service sits on the wrong interface. It may be bound to
127.0.0.1instead of0.0.0.0. - A TLS error is a cert problem. Use
openssl s_client -connect server:Zto see the full handshake and cert chain.
- Capture packets on the server with
sudo tcpdump -i eth0 -nn port Z. If SYN packets arrive but get no reply, the kernel is dropping them, usually because of the firewall orrp_filterreverse-path filtering. - Check routing with
ip route get <client-ip>on the server to confirm the reply path. Then runtraceroute <server-ip>ormtr <server-ip>from the client to find where packets get lost. - Check DNS with
dig serverfrom the client. If the hostname resolves to the wrong IP, no amount of firewall work will help.
The steps run from cheapest to priciest: one quick command first, a packet capture and route trace last. Most faults show up in steps 1-3. For a hardened nftables baseline to start from, securing a fresh server in 30 minutes covers the firewall along with SSH and kernel settings.
Application-layer debugging with curl and openssl
Sometimes the TCP connection works but the protocol on top of it fails. Two tools cover this.
curl -v shows the TLS handshake, HTTP request headers, and response headers:
curl -v https://example.comLook for cert errors, odd redirects, and HTTP status codes in the output.
To dig into TLS, openssl s_client shows the full cert chain, protocol version, cipher suite, and handshake errors:
openssl s_client -connect example.com:443 -servername example.comThe -servername flag sends the SNI extension. Servers that host several TLS certs on one IP need it.
To check just the expiry dates:
openssl s_client -connect example.com:443 2>/dev/null | openssl x509 -noout -datesAn expired or wrong-name cert is one of the top causes of a broken HTTPS service. If you run many subdomains, one wildcard cert for all your subdomains cuts the list you have to watch down to one.
Advanced techniques
For containers, VPNs, and speed problems, these tricks go past the basics.
To check sockets inside Docker or Podman containers, enter the network namespace:
# Using network namespaces directly
ip netns exec <namespace> ss -tlnp

# Or use nsenter with the container's PID
nsenter -t <PID> -n ss -tlnp
MTU mismatches cause a lot of odd failures. They hit VPN tunnels and Docker overlay networks hardest, because the extra wrapper on each packet shrinks the usable MTU. Test with:
ping -M do -s 1472 <host>If that fails with “message too long,” the path has an MTU mismatch. tcpdump will show ICMP “fragmentation needed” messages.
For NAT debugging, conntrack -L prints the kernel’s NAT table with every live DNAT and SNAT mapping. Reach for it when Docker port mappings or load balancer rules do not act the way you expect:
conntrack -LBefore you blame the network for slowness, measure real throughput with iperf3 :
# On the server
iperf3 -s

# On the client
iperf3 -c server-ip
iperf3 reports throughput, jitter, packet loss, and bandwidth per interval. Run it before and after a change to confirm the fix worked.
mtr
folds ping and traceroute into one tool that probes every hop, over and over:
mtr --tcp -P 443 server-ipThe --tcp flag with -P 443 sends TCP SYN packets instead of ICMP. That helps, because many firewalls block ICMP but allow TCP on common ports.
Finally, tc -s qdisc show tells you if the kernel is shaping, queuing, or dropping packets. High drop counts on a qdisc mean traffic shaping is your speed problem. For a deeper look inside the kernel at network events and packet flows, eBPF performance monitoring
traces live without any kernel code changes.
Quick reference
| Task | Command |
|---|---|
| Is the service listening? | ss -tlnp sport = :PORT |
| What is connected? | ss -tnp |
| Show firewall rules | nft list ruleset |
| Trace firewall decisions | nft monitor trace |
| Capture packets on a port | tcpdump -i eth0 -nn port PORT |
| Save capture to file | tcpdump -i eth0 -w file.pcap port PORT |
| Check TLS certificate | openssl s_client -connect host:443 |
| Measure throughput | iperf3 -c server |
| Trace network path | mtr --tcp -P PORT host |
| Show NAT translations | conntrack -L |
| TCP internal stats | ss -ti |
Print this table or save it as a cheat sheet of aliases. The commands are short, so you will know them by heart after a few runs. Having them on hand during a 3 AM outage saves real time.