 Botmonster Tech
You won't believe your home's radon levels: a $150 ESPHome detector reveals them
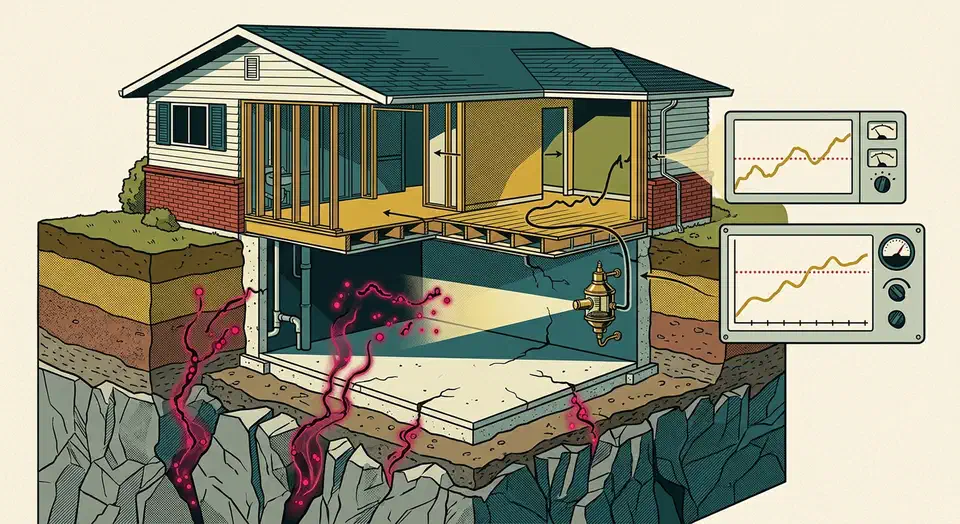
Radon is a colorless, odorless radioactive gas that seeps from soil and rock. It is the second-leading cause of lung cancer after smoking. The only way to know your exposure is to measure it over months, not minutes. Indoor levels swing by ten times between calm winter nights and breezy summer afternoons. The cleanest build I have found in 2026 pairs the FTLab RD200M sensor with an ESP32 running ESPHome. The RD200M is a pulsed ion chamber with a simple UART output. The node sends live and rolling-average readings to Home Assistant. It also fires alerts when your annual average creeps toward the EPA action level of 4 pCi/L (148 Bq/m3). Total parts cost is about 150 USD, roughly half the price of an Airthings View Plus, and you own every byte of the data.
Why Long-Term Radon Monitoring Is Worth It
Radon comes from the decay of uranium-238 in soil and rock. That is why basements, slab-on-grade homes, and ground-floor rooms gather it faster than upper floors. The gas itself is inert. Its short-lived daughter products, polonium-218 and polonium-214, are the problem. They stick to dust, lodge in lung tissue when you breathe them in, and fire alpha particles at close range. That damage to DNA drives the 21,000 yearly radon-linked lung cancer deaths the EPA estimates in the United States.
Two reference levels dominate the talk. The WHO recommends 100 Bq/m3 as an annual average and says never to exceed 300 Bq/m3. The EPA lands higher, at 148 Bq/m3 (4 pCi/L), and also flags 75 to 148 Bq/m3 as a zone to think about fixing. The EU 2013/59/Euratom directive sets 300 Bq/m3 as the workplace action level. Canada uses 200 Bq/m3 as its federal guideline. You will see both becquerels and picocuries in sensor output and in rules. Keep the conversion handy: 1 pCi/L equals 37 Bq/m3.
The long-term average is the thing most people get wrong. Hour-to-hour swings of 10x are routine. Pressure shifts, HVAC cycles, wind on the building, and the stack effect all push the number around. The stack effect is warm indoor air rising and pulling soil gas in through cracks. A 48-hour charcoal canister test can miss reality if the weather that week is odd. Health agencies trust a reading as a yearly proxy only when it spans at least 90 days of non-stop tracking. That is exactly what a fixed ESPHome node is built to do. If your home has a finished lower level used as a bedroom or office, sits in an EPA Radon Zone 1 area, or was built on a porous soil, a permanent monitor beats any one-shot test.
Hardware: Pick the Right Sensor, Then the Right ESP32
The hobbyist radon sensor market is narrow. The FTLab RD200M is the module that puts out calibrated data over a simple serial link. It uses the same sensing element that sits inside the Airthings and RadonEye consumer products. The specs that matter:
| Parameter | Value |
|---|---|
| Sensor type | Pulsed ion chamber |
| Sensitivity | 0.5 cpm per pCi/L (30 cph per pCi/L) |
| Data interval | 10-minute step, 60-minute internal moving average |
| Range | 0.1 to 99.99 pCi/L (roughly 4 to 3700 Bq/m3) |
| Accuracy | Better than +/-10 percent above 10 pCi/L, min error +/-0.5 pCi/L |
| Interface | UART, 9600 baud, 8N1 |
| Operating range | 10 to 40 C, RH below 90 percent |
| Size | 68 mm diameter, 98 mm tall |
| Price | Around 80 USD direct from FTLab or via specialty distributors |
Avoid the cheap MQ-series “radon” modules on AliExpress. They are metal-oxide gas sensors that react to VOCs, not alpha particles. No amount of clever firmware will make them report real radon levels.
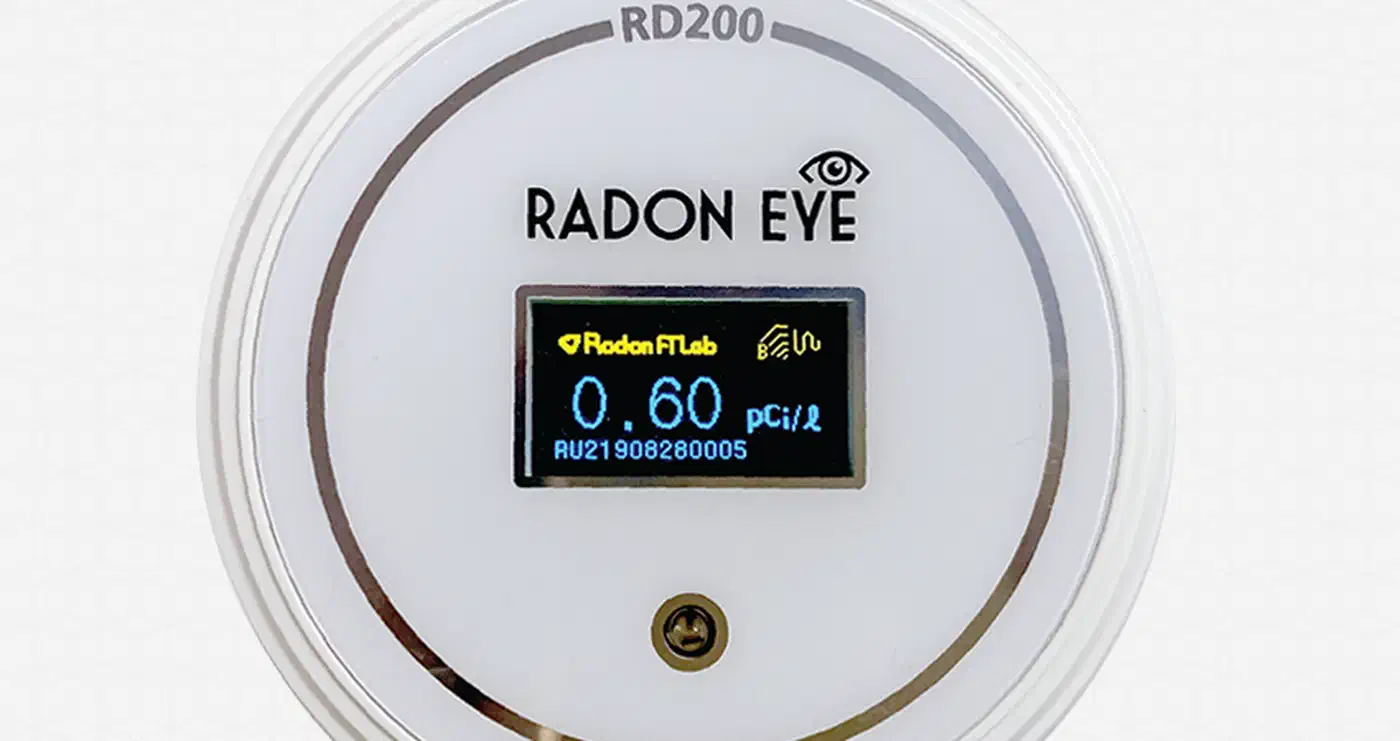
For the ESP32 side there are two sensible options in 2026. The ESP32-S3-DevKitC-1 has dual cores, native USB-C, and plenty of RAM for ESPHome’s API with encryption. It also works out of the box with the Arduino framework that most ESPHome components target. The ESP32-C6 adds an 802.15.4 radio. It can expose the radon reading as a Matter-over-Thread device. That is useful if you want the sensor to show up in Apple Home or Google Home next to Home Assistant. If you do not already operate an OpenThread gateway, stay with the S3 and skip that setup.
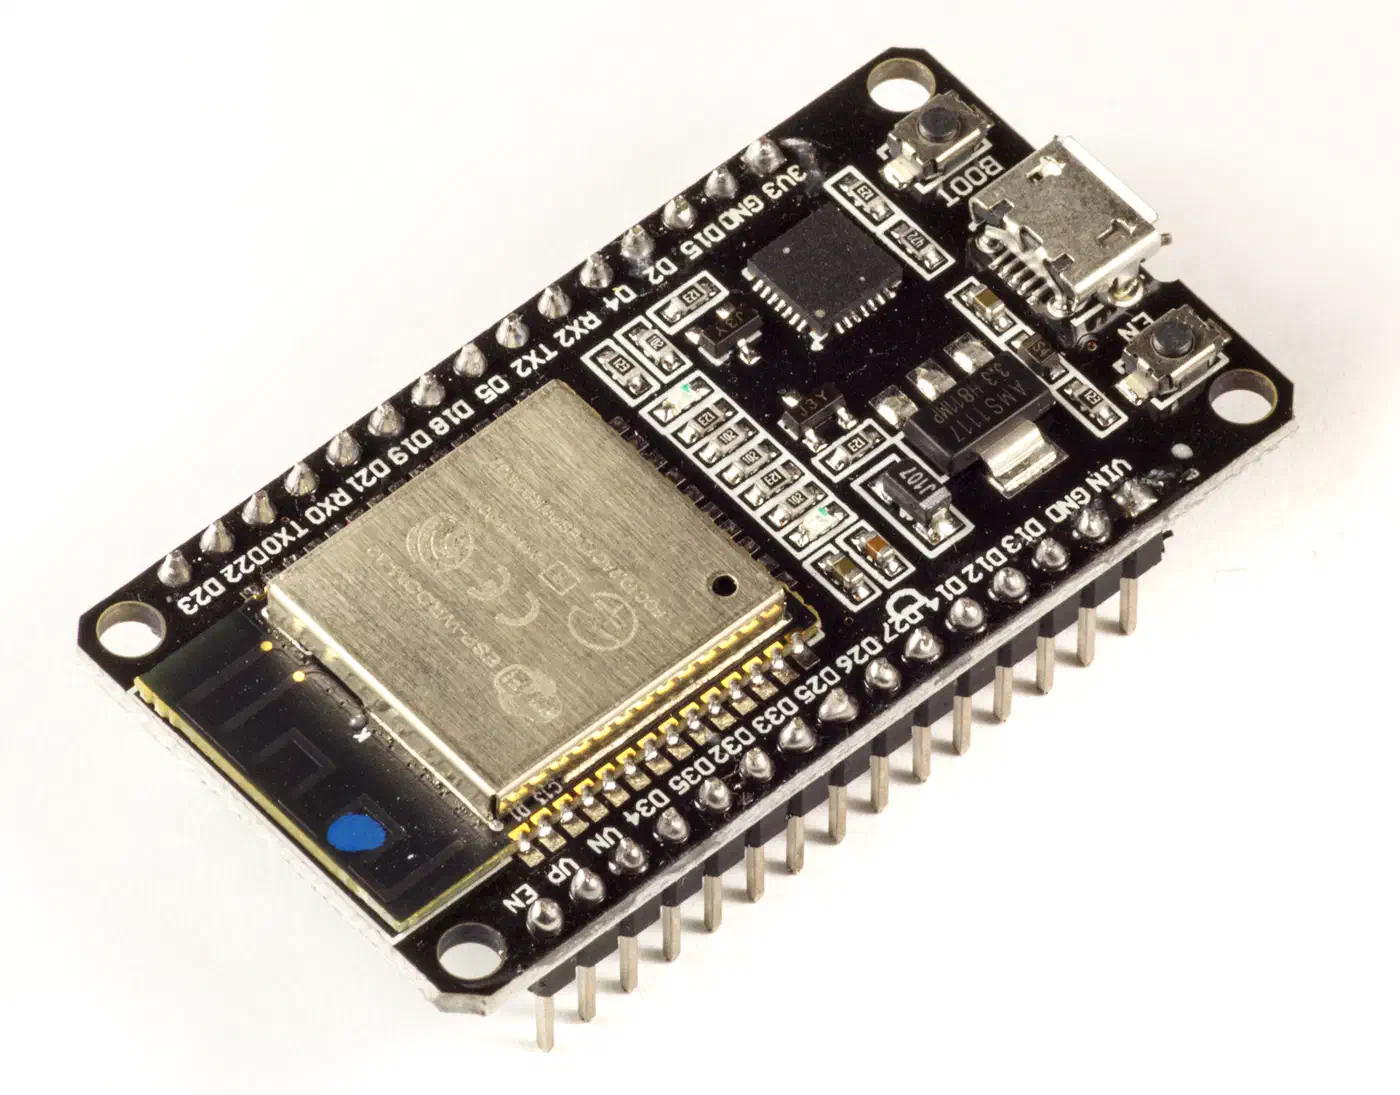
A standard 5V/1A USB supply is more than enough for the RD200M’s 60 to 65 mA draw. Battery use is pointless. Radon tracking is a fixed-spot, always-on job, and every power cycle throws away the 24-hour rolling buffer the sensor has built up. Two worthwhile add-ons round out the build. A BME280 brings temperature, humidity, and pressure, so you can link radon spikes to weather fronts after a few weeks of data. An SSD1306 OLED gives you a quick local readout when Home Assistant is offline. Line-itemed, a full build is about 80 USD for the RD200M, 15 USD for the ESP32-S3, 6 USD for the BME280, 5 USD for a small OLED, 10 USD for a 3D-printed box and vent mesh, plus wiring and shipping. That lands near 150 USD.
Wiring and Placement
Wiring the RD200M takes four wires: 5V, ground, the sensor’s TX to the ESP32’s RX, and the sensor’s RX to the ESP32’s TX. The module runs on a 5V supply but talks 3.3V logic, so no level shifter is needed for any ESP32 variant. On the ESP32-S3 with native USB I use GPIO17 for TX and GPIO18 for RX. That keeps UART0 free for the built-in USB-CDC logger. On a classic ESP32 you have to use UART1 or UART2. UART0 is busy with the serial bridge, and ESPHome’s logging will fight the sensor for bytes.
Enclosure design gets skipped too often. The ion chamber needs to breathe, so the case needs vented sides or mesh panels. A 3D-printed PETG box with 5 mm vent holes on two opposite faces works well. It keeps dust off the high-voltage grid inside the sensor. Do not seal the box. Do not put it in direct sunlight. Do not mount it on an outside wall where the inside surface temperature swings wildly.
Placement follows the EPA Citizen’s Guide to Radon. Put the sensor on the lowest lived-in level of the home, between 50 cm and 2 m above the floor, and at least 90 cm from outside walls, windows, and HVAC vents. Skip kitchens (cooking steam), bathrooms (steam plus short use), and crawlspaces (not lived in, so the number does not match what you breathe). Stay away from ceiling fans and return registers. Forced airflow thins the local reading with fresh air and biases it low.
Budget time for the warm-up. The RD200M needs about 60 minutes after power-on before its readings settle. It needs a full 24 hours before its internal rolling average is meaningful. If you see zeros or clearly wrong numbers in the first hour, do not panic and do not start resoldering.
ESPHome YAML: UART Component and External Component
ESPHome does not ship a built-in RD200M driver. The external components system makes it easy to pull in a community one. The YAML below is the minimum that works on an ESP32-S3-DevKitC-1 with a single UART and an encrypted API link to Home Assistant:
esphome:
  name: radon-basement
  friendly_name: Radon Basement

esp32:
  board: esp32-s3-devkitc-1
  framework:
    type: esp-idf

external_components:
  - source: github://ekyuho/Rd200m
    components: [rd200m]

uart:
  id: uart_rd200m
  tx_pin: GPIO17
  rx_pin: GPIO18
  baud_rate: 9600
  parity: NONE
  stop_bits: 1

sensor:
  - platform: rd200m
    uart_id: uart_rd200m
    update_interval: 10min
    bq_m3:
      name: "Radon Bq per m3"
      state_class: measurement
      filters:
        - sliding_window_moving_average:
            window_size: 144
            send_every: 144
            send_first_at: 144
    pci_l:
      name: "Radon pCi per L"
      state_class: measurement

logger:
  level: INFO

api:
  encryption:
    key: !secret api_key

ota:
  - platform: esphome
    password: !secret ota_password

wifi:
  ssid: !secret wifi_ssid
  password: !secret wifi_password

captive_portal:
Several pieces need context. The update_interval sits at 10 minutes because the sensor only puts out a new reading every 600 seconds. Polling faster just copies the same data. The sliding window with 144 samples and send_every: 144 builds a 24-hour average on the device itself. Even if your Home Assistant box is offline for a day, the ESP32 keeps its own rolling buffer and resends the number the moment the API reconnects. Setting state_class: measurement hooks the sensor into Home Assistant’s long-term statistics. That store keeps hourly min, mean, and max forever without bloating the recorder database with raw samples.
You can layer more onto the same YAML once the basics work. A binary_sensor: template that flips on when the 24-hour average crosses 100 Bq/m3 gives you a single entity to feed an automation. An interval: that swaps an onboard RGB LED between green and red on the same threshold gives a local warning even if the network is down. If you add the BME280, its pressure reading is the most useful pair-up. Radon levels rise when outside pressure drops, because lower outside pressure lets more soil gas vent into the house. A DIY weather station with pressure logging gives you an outside pressure trace to line up against your radon data.
Two first-boot errors show up often enough to head off. “Invalid UART data” or garbage in the logs almost always means TX and RX are swapped. The RD200M’s TX needs to reach the ESP32’s RX pin. “No response from sensor” is usually a power problem. A long USB cable or a laptop port can drop the 5V rail enough that the chamber’s electronics brown out. Plug into a proper 5V/1A wall supply before you suspect the firmware.
Home Assistant: Rolling Averages, Long-Term Stats, and Tiered Alerts
Once the ESPHome API is paired, Home Assistant finds sensor.radon_bq_per_m3 and sensor.radon_pci_per_l on its own. The fun part is building windows that match the EPA’s guidance. The raw 10-minute reading is too noisy to act on. Use the built-in statistics integration to build a 7-day and a yearly mean:
sensor:
  - platform: statistics
    name: "Radon 7 Day Mean"
    entity_id: sensor.radon_bq_per_m3
    state_characteristic: mean
    max_age:
      days: 7
    sampling_size: 1200

  - platform: statistics
    name: "Radon Annual Mean"
    entity_id: sensor.radon_bq_per_m3
    state_characteristic: mean
    max_age:
      days: 365
    sampling_size: 60000
The sampling_size has to clear the number of samples in the window with room to spare. A 10-minute update interval gives 144 samples per day, so 365 days is roughly 52,560 samples. 60,000 leaves headroom. If you want an honest confidence flag, wrap the yearly mean in a template sensor that exposes a “days of data collected” attribute and a traffic-light status that only turns green after 90 days.
Alerting works best in tiers. Radon reacts to weather, and a single-threshold alert will wake you up on any stormy Tuesday. I use three levels:
- Info note when the 7-day mean crosses 100 Bq/m3 (WHO reference).
- Action warning when the yearly mean crosses 148 Bq/m3 (EPA action level).
- Urgent alert when the 24-hour mean crosses 200 Bq/m3, calling for fast ventilation.
For the dashboard, the ApexCharts Card handles the visual cleanly. A single panel can show live, 24-hour, 7-day, and yearly averages as stacked lines. Add flat reference lines at 100 and 148 Bq/m3, and you get the seasonal context a single number can never convey.
Calibration takes less effort than you might guess. The RD200M ships factory-calibrated to better than 10 percent. If you want a sanity check, order a charcoal canister kit from your state health department. Run it next to your ESPHome node for 7 days. Then compare the canister result to your sensor’s 7-day mean. Agreement within plus or minus 20 percent is normal and means the node is working.
When To Buy Instead of Build
Not every home needs a DIY build, and the store-bought options deserve a fair look before you start soldering. The Airthings View Plus costs 299 USD. It ships with radon, CO2, PM2.5, VOC, humidity, temperature, and pressure sensors in one box, and has a polished app.
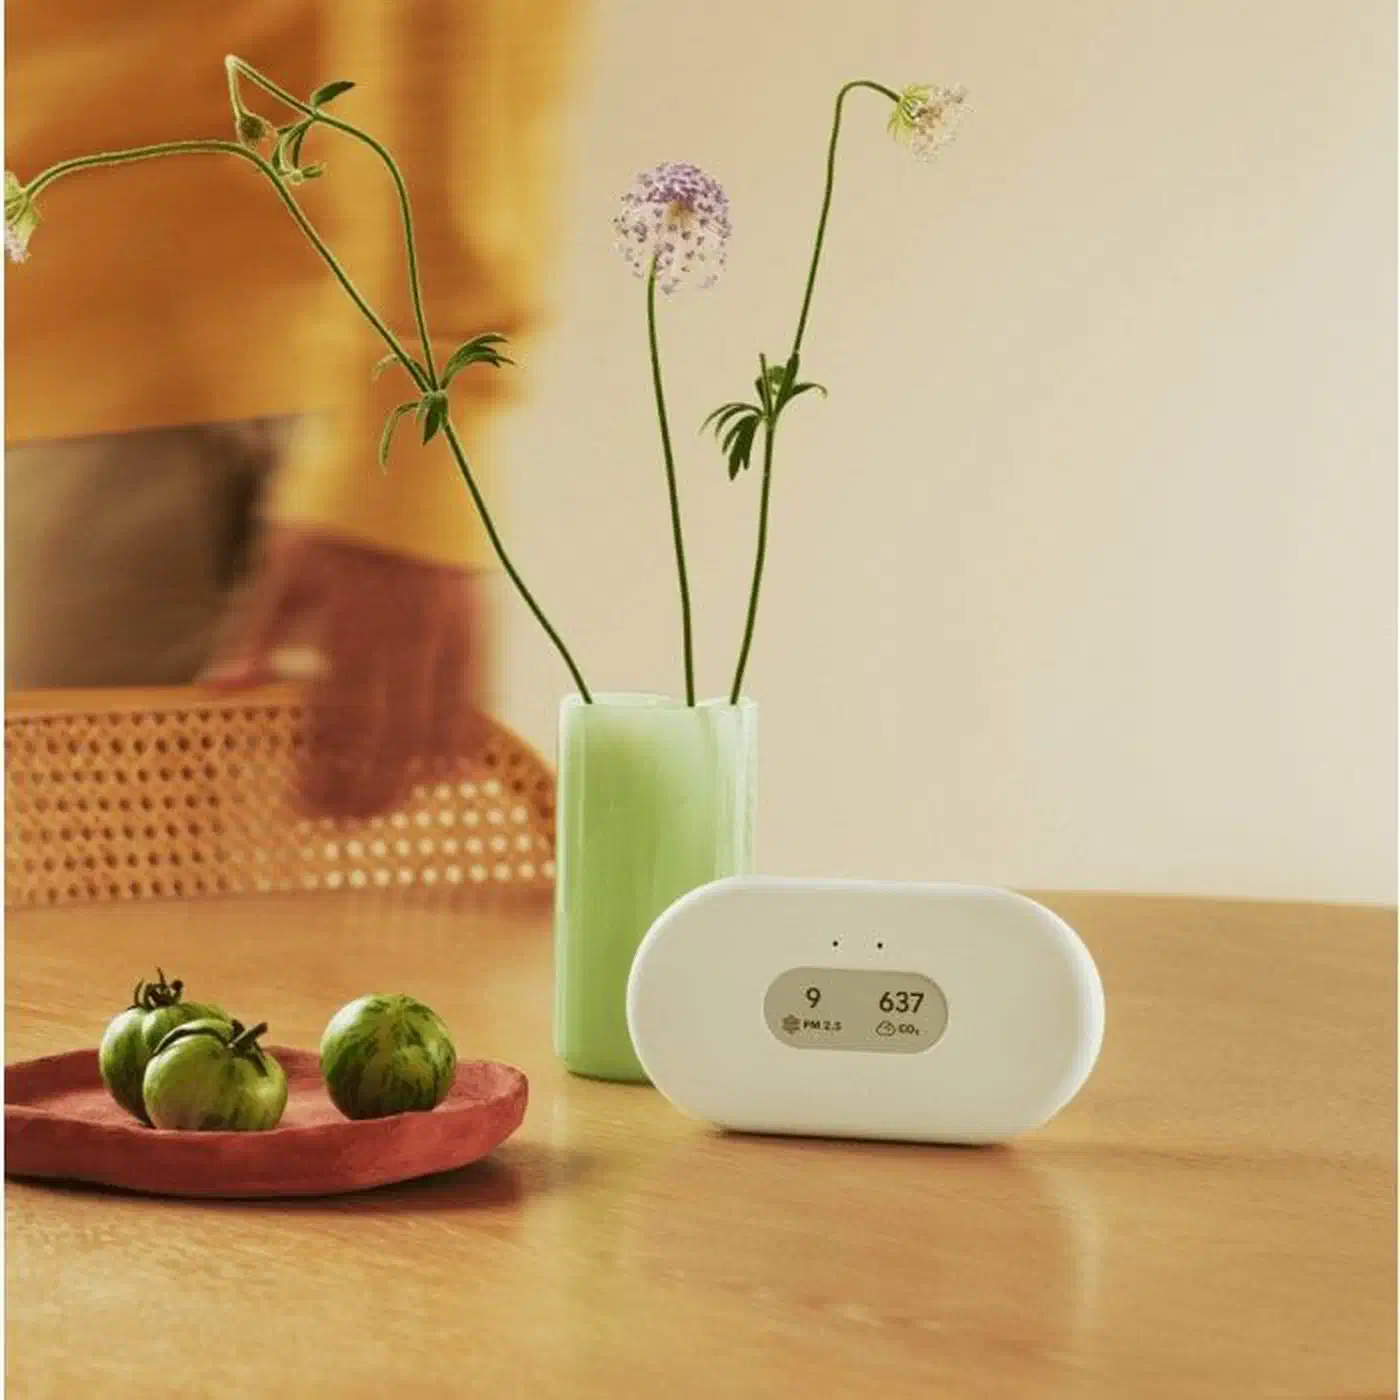
DIY wins when you already run Home Assistant, want multi-year local history, or want to line up radon against pressure from your own weather station. The same ESPHome and Home Assistant stack also drives outdoor projects like a weather-aware sprinkler controller, so the skills carry over. A commercial unit wins in a few cases. The sensor is going into a rental or a relative’s home where you cannot push ESPHome updates. You need CO2 and PM2.5 in the same box. Or you want a warranty with a phone number attached.
If your yearly average does cross 148 Bq/m3, the next step is sub-slab depressurization. That is a fan-driven system that pulls soil gas from under the foundation and vents it above the roofline. Installation runs 800 to 2500 USD nationally and usually cuts indoor radon by 90 to 99 percent. The non-stop fan adds about 60 to 125 USD per year to your electricity bill, a cost you can watch in real time once the fan circuit shows up as its own monitored device in Home Assistant. An ESPHome node is also the right tool to measure the before-and-after. You can see the fix take effect in the rolling averages within days of install.