 Botmonster Tech
llmfit tells you which local models your machine can run

Which LLM can I run on my hardware is a question most calculators answer with a guess. llmfit closes the loop. It ranks 5,372 models against your RAM, CPU, and GPU, then measures the winner for real. On my RTX 4080 it predicted 40.9 tokens per second and the benchmark returned 68.2.
Key Takeaways
- llmfit reads your actual hardware and ranks every model it knows about.
- It scores four things at once: fit, speed, quality, and context.
- Big models that use only part of themselves get sized correctly.
- One benchmark on my card beat the prediction by 40 percent.
- That single measurement then corrected every other estimate on the machine.
Which LLM can I run on my hardware, and why VRAM alone lies
The rule of thumb fits on one line. Multiply the parameter count by the bytes per parameter, then compare that against your VRAM. It is right often enough to be dangerous, and plenty of people defend it.
FYI all you need is the size of an LLM and the memory amount & bandwidth to know if it fits and the tok/s.
The formula does get you close. It also breaks in four places.
Start with context. The key-value cache grows with the conversation, so a model that fits at 4,000 tokens can fail at 32,000. On my RTX 4080, llmfit plan puts Qwen3.5-9B at 6.6 GB of minimum VRAM with a 4,000-token window. Push it to 32,000 and it wants 10.1 GB. Ask for the model’s full 131,000-token context and it needs 22.1 GB, which my 16 GB card doesn’t have. Same model, same quantization, three different answers.
Sparse architectures are worse. Mixture-of-experts models activate only a fraction of their weights per token, so total parameter count wildly overstates what you need in VRAM. Mixtral 8x7B looks like a 23.9 GB problem on paper. llmfit reads the architecture and sees two of eight experts firing per token. It reports 7.7 GB of active weights, with the other 18.3 GB parked in system RAM. The same reading decides whether a giant release is worth chasing at all: a cheap 1.6-trillion-parameter model like DeepSeek V4-Pro fires only about 49 billion weights per token, yet still needs the memory llmfit sizes for you. The same reading applies to Qwen3.8-Max’s 2.4-trillion-parameter design , which activates about 95 billion weights per token.
Mixed hardware defeats it entirely. Two different GPUs, or a GPU plus offload to system memory, are not one big pool. A single VRAM total tells you nothing useful about either.
The last gap costs you an evening: a model can fit and still be unusable. That same Mixtral did fit on my card, at 86.8 percent memory utilisation. llmfit still scored its speed at 21 out of 100 and estimated 8.6 tokens per second, which is a model you would abandon within a day.
So llmfit gives every model four separate scores instead of one yes or no:
| Dimension | What it measures |
|---|---|
| Fit | How efficiently the model uses your memory, with a sweet spot of 50 to 80 percent |
| Speed | Estimated tokens per second for your backend, quantization, and run mode |
| Quality | Parameter count, family reputation, quantization penalty, and task alignment |
| Context | Usable context window against what your chosen task needs |
Those four combine into one composite score, weighted by use case: chat puts 0.35 of the weight on speed, while reasoning puts 0.55 on quality. The top of the table changes depending on what you asked for.
How to find out which models run well on your machine
Install llmfit, read the ranked table, then verify the estimate for the model you picked with a real benchmark.
Install it
Use brew install AlexsJones/llmfit/llmfit on macOS or Linux, scoop install llmfit on Windows, or uv tool install -U llmfit if you already run uv. MacPorts users get port install llmfit.
Open the terminal interface
Run llmfit with no arguments. Your detected specifications sit at the top of the screen, with every model scored below them, sortable and filterable.
Check the detection was right
Run llmfit doctor for the full hardware report. It prints the raw nvidia-smi output next to what llmfit made of it. If it misreads your GPU or your VRAM, nothing below it is right.
Read the ranked table
Run llmfit fit for the classic table of every model ranked by fit, if you prefer plain output to the interface. Add -n 12 to cap the rows.
Narrow by what you actually do
Run llmfit recommend --use-case coding to filter to models suited to a task rather than the general ranking. The other use cases are general, reasoning, chat, multimodal, and embedding.
Inspect one model before downloading
Run llmfit info "<model>" to see the fit analysis, the disk size at every quantization, what the speed estimate assumes, and the exact commands to verify it.
Measure instead of trusting
Serve the model with your provider, then run llmfit bench to record real tokens per second and time to first token on your machine.
Contribute the numbers back
The interface can submit your benchmark as a pull request, so anyone with the same hardware sees measured values in the next release.
How the speed estimate is built, and how to check it
Token generation is bound by memory bandwidth, because every token requires reading the whole model out of VRAM once. llmfit turns that into a roofline formula: bandwidth divided by model size, times an efficiency factor of 0.55. That factor covers kernel overhead and cache reads. A lookup table supplies real bandwidth numbers for about 80 GPUs across NVIDIA, AMD, and Apple silicon.
llmfit also shows its work. Running llmfit info "Qwen/Qwen3.5-9B" on my box printed this basis:
Estimate Basis:
  Method: GPU bandwidth roofline, 717 GB/s x 0.55 efficiency
  Models single-request generation at ctx <= 8192 tokens; prompt processing
  (prefill/TTFT) is not estimated. Baseline error band is roughly +/-30%.
  Verify on this machine:
    llmfit bench "Qwen/Qwen3.5-9B"    (against a running provider)
    llama-bench -m <path-to-Q8_0-gguf> -ngl 99 -p 512 -n 128
Three admissions sit in that block. The estimate ignores prompt processing entirely, it assumes a short context, and it declares its own error band at roughly plus or minus 30 percent. That is unusually blunt for a tool whose whole pitch is prediction. A bandwidth model gets the shape of performance right and the exact figure wrong, and llmfit says so in its own output.
this is visually fantastic, but while trying this out, it says I can’t run Qwen 3.5 on my machine, while it is running in the background currently, coding.
That is exactly why llmfit bench exists. So I ran it. I downloaded the Q8_0 build of Qwen3.5-9B, served it with llama-server, and pointed llmfit bench at the live endpoint. It fired three real inference passes and averaged 68.2 tokens per second against a predicted 40.9.
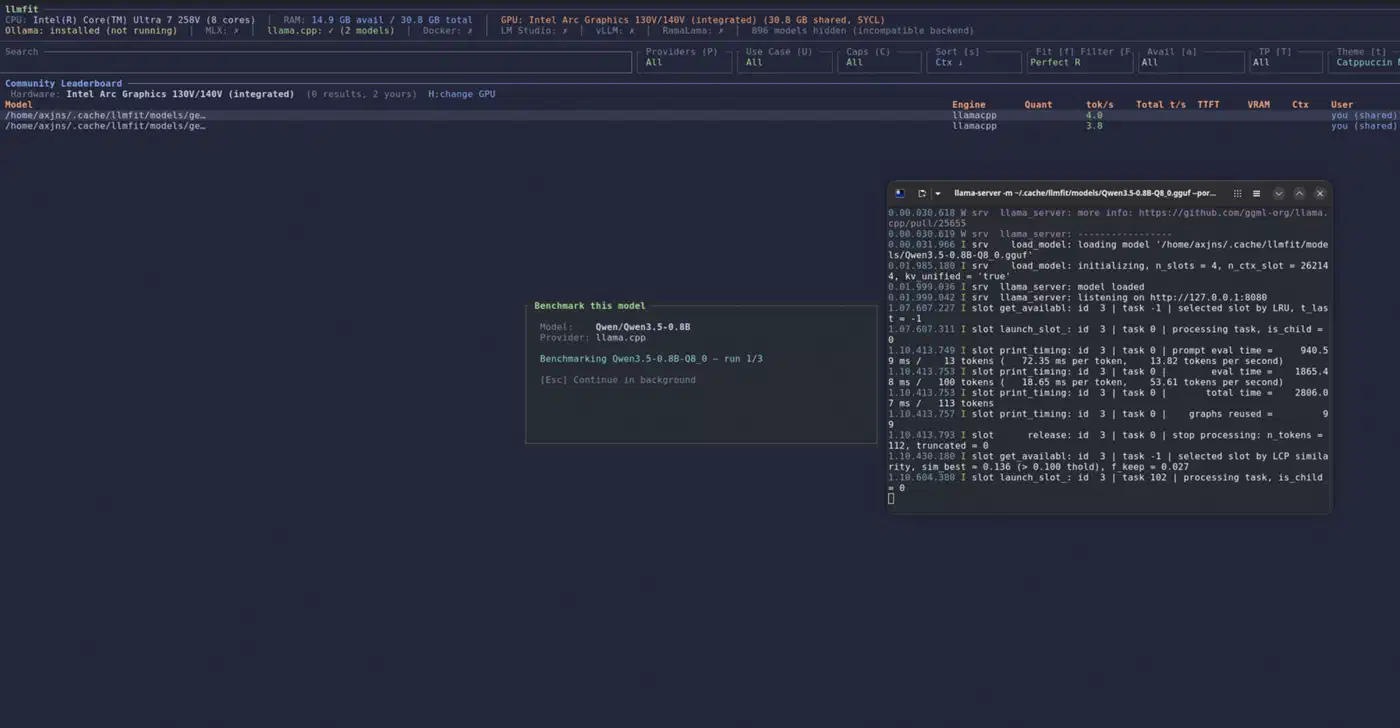
That 40 percent gap sits well outside the plus or minus 30 percent band llmfit advertises. It errs in the direction you want, though: the tool undersells your hardware. Part of the gap is my setup, since I served through the Vulkan build rather than CUDA. Most of it is that 0.55 efficiency factor being conservative for a card like this.
One measurement recalibrates the whole table
Before the benchmark, the top of my fit table read like this:
| Model | Before | After one benchmark |
|---|---|---|
| Qwen3.5-9B | 40.9 est. | 68.2 measured |
| Qwen2.5-Coder-14B-Instruct-AWQ | 53.4 est. | 89.2 est. |
| gemma-4-E4B-it | 49.3 est. | 82.3 est. |
| Phi-4-multimodal-instruct | 37.6 est. | 62.7 est. |
One benchmark on one model rescaled every other estimate on the machine by the same 1.67 factor. The benchmarked row now carries a tick to mark it as measured, and the rest inherit the correction. Every run also saves locally first, under ~/.local/share/llmfit/benchmarks/pending/, so nothing is lost if you never share it.
Sharing is one flag: llmfit bench --share forks the repo, commits your result, and opens a pull request. You don’t need the gh CLI or a third-party account, because authentication runs through the GitHub device flow. A --dry-run prints the exact payload first, which is how I checked mine without submitting anything.
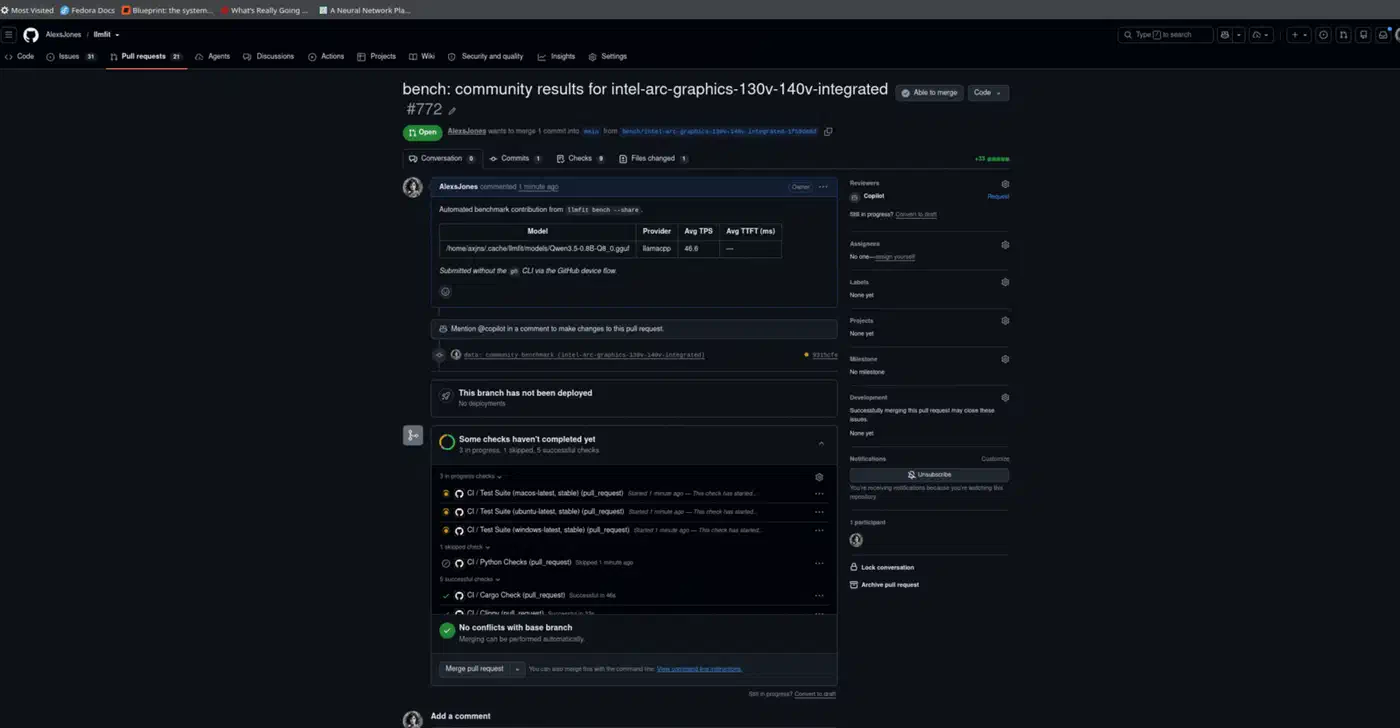
That dry run also surfaced a wart. For the llama.cpp provider, the model field records the absolute path to your GGUF file rather than the model name. Mine read /home/botmonster/.cache/llmfit/models/Qwen3.5-9B-Q8_0.gguf, so a careless submission publishes your username. The accepted files in the repo store a plain filename, so this is worth checking before you press share.
Merged submissions get compiled into the next binary, so someone with an identical CPU and GPU sees a measured number before they ever benchmark anything. Uptake is the weak link in that design. The public community folder holds 14 accepted submissions across eight GPUs, from a Tesla T4 to an RTX 5070, in a project with over 31,000 stars. A validation workflow checks every incoming file against a JSON schema, so what does land is clean.
Working with the runtimes you already have
llmfit detects five model backends and adapts its advice to each.
| Runtime | How llmfit finds it |
|---|---|
| Ollama | Queries localhost:11434, or wherever OLLAMA_HOST points |
| llama.cpp | Looks for llama-cli or llama-server on your PATH, plus the local GGUF cache |
| MLX | Reads the mlx-community model cache on Apple silicon |
| Docker Model Runner | Queries Docker Desktop’s engine list on port 12434 |
| LM Studio | Talks to the local server on port 1234, and downloads through its API |
MLX on a Mac is a different performance story from llama.cpp on the same box, so llmfit picks a runtime per model instead of assuming one. Quantization works the same way. Nothing is hardcoded to Q4; it walks the hierarchy from Q8_0 down to Q2_K and takes the best quality that fits. On my card it chose Q8_0 for a 9B model and left 27 percent of VRAM free. That is the same call you make by hand when you size Llama 4 Scout for a 24 GB card, only faster.
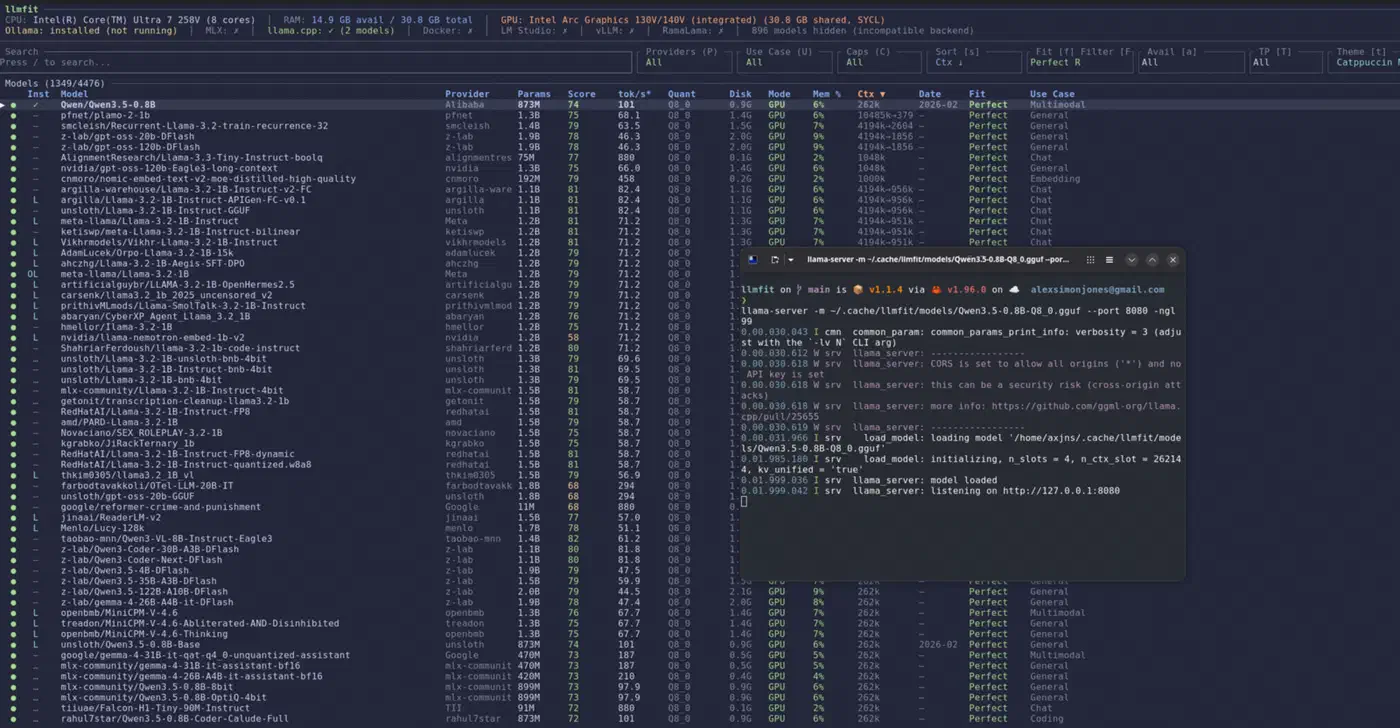
For scripts and agents, llmfit recommend --json emits structured output, and the container image skips installation entirely:
podman run ghcr.io/alexsjones/llmfit recommend --use-case coding | jq '.models[].name'The same image runs the interface with docker run --rm -it ghcr.io/alexsjones/llmfit --tui. There is also llmfit serve, a small REST API meant for cluster schedulers that need to ask a node what it can run.
If the catalog doesn’t know your model, you can drop a custom_models.json into llmfit’s data directory and it loads without a rebuild. Contributing the model upstream is documented too. For the next step after picking a model, the same author maintains llmserve
for serving one, and llama-panel
for wrangling llama-server instances on macOS.
Where it fits next to just downloading and trying
Downloading a model and seeing what happens is a real alternative, and it’s sometimes the better plan.
| Approach | Cost | What you learn |
|---|---|---|
| llmfit | Seconds, no download | Ranked fit, speed, quality, and context across the whole catalog |
| llm-checker | Minutes plus a full pull | Real behaviour, one model at a time, through Ollama |
| Download and try | A 20 GB download per guess | The definitive answer for exactly one model |
llm-checker is the alternative the project itself points readers at, and llmfit’s own README adds a caveat worth repeating. llm-checker treats every model as dense, so its memory figures for architectures like Mixtral reflect total parameters rather than the smaller active subset.
The catalog freshness question came up loudly when llmfit reached the Hacker News front page with a 301-point thread.
This is a great idea, but the models seem pretty outdated - it’s recommending things like qwen 2.5 and starcoder 2 as perfect matches for my m4 macbook pro with 128gb of memory.
That complaint has largely been answered. The version I tested ships 5,372 models from 1,551 providers, 794 of them sparse. The newest entries were added to Hugging Face only weeks before the release itself. The database is scraped from the Hugging Face API and baked into the binary, so freshness tracks your llmfit version rather than a live feed. Upgrade the tool and you upgrade the catalog.
Detection held up on my machine. llmfit doctor read the Ryzen 9 5900X, all 62.7 GB of RAM, and the RTX 4080’s 15.99 GB of VRAM correctly, then picked CUDA as the backend. It also hid 550 models as incompatible with that backend, which is more filtering than I would ever do by hand.
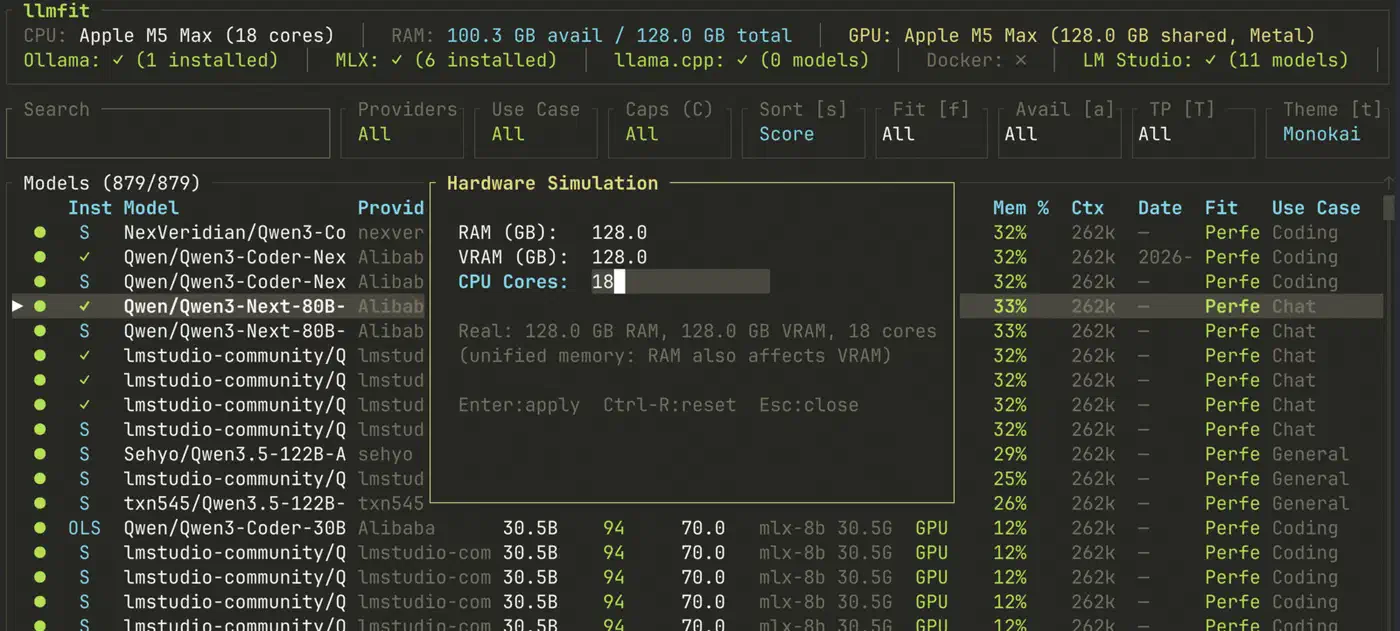
The interface also has a simulation popup for people pricing a new card. Override RAM, VRAM, and CPU cores, then re-score the whole catalog against hardware you don’t own yet. It helps when you are spec’ing a quiet local-AI desktop and want to know what it will run before you buy the parts.
The project is MIT licensed and written in Rust. Windows release binaries carry Authenticode signatures through SignPath . The stated privacy behaviour is that llmfit reaches the network only when you use a feature that needs it. With 77 contributors and 37 open issues, it is actively maintained.
It pays off most if you are shopping for a GPU , running an unusual configuration, or maintaining a machine that other people share. If you already suspect one specific model will work, skip the tool and download it. For everything else, a few seconds in a terminal beats a 20 GB experiment.