 Botmonster Tech
jcode's tiny memory number comes with a feature turned off

jcode RAM usage is quoted everywhere as 27.8 MB, and that number is real. It is also measured with the tool’s headline memory feature switched off. Run jcode the way it ships and one session sits at 167.1 MB, above Codex CLI at 140.0 MB. The scaling claim, though, holds up fine.
Key Takeaways
- The famous 27.8 MB figure needs jcode’s memory feature switched off first.
- With default settings, one jcode session uses 167 MB, more than Codex CLI.
- The claim that survives is scaling: each extra session adds about 10 MB.
- Ten jcode sessions fit in less memory than one Claude Code session.
- Every number here was measured by the project itself, on one machine.
What jcode is
jcode is a coding agent harness. That means a terminal program that points a model at your repository, edits files, runs commands, and shows the whole thing in a text interface. If you have used Claude Code or Codex CLI, you already know the shape. In a crowded field, cost and lock-in usually decide the pick long before memory does.
The practical difference is that jcode is not tied to one model vendor. It ships login flows for Anthropic, OpenAI, Gemini, Copilot, Azure, and a long tail of aggregators, plus local servers through Ollama and LM Studio. You bring the subscription you already pay for. OpenCode chose the same freedom to swap models. What you teach the harness is portable too, which is the argument behind keeping tooling in portable skill files.
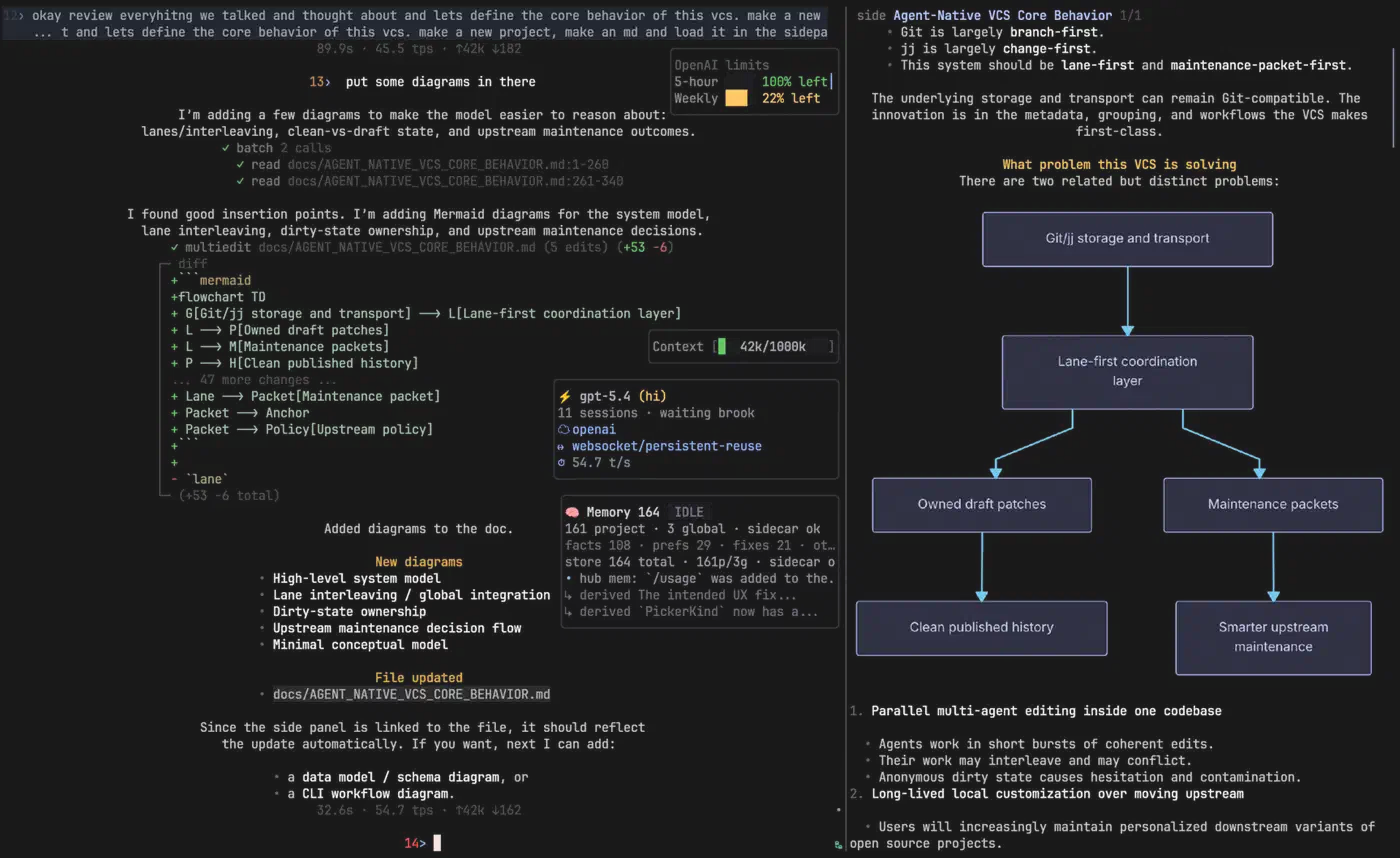
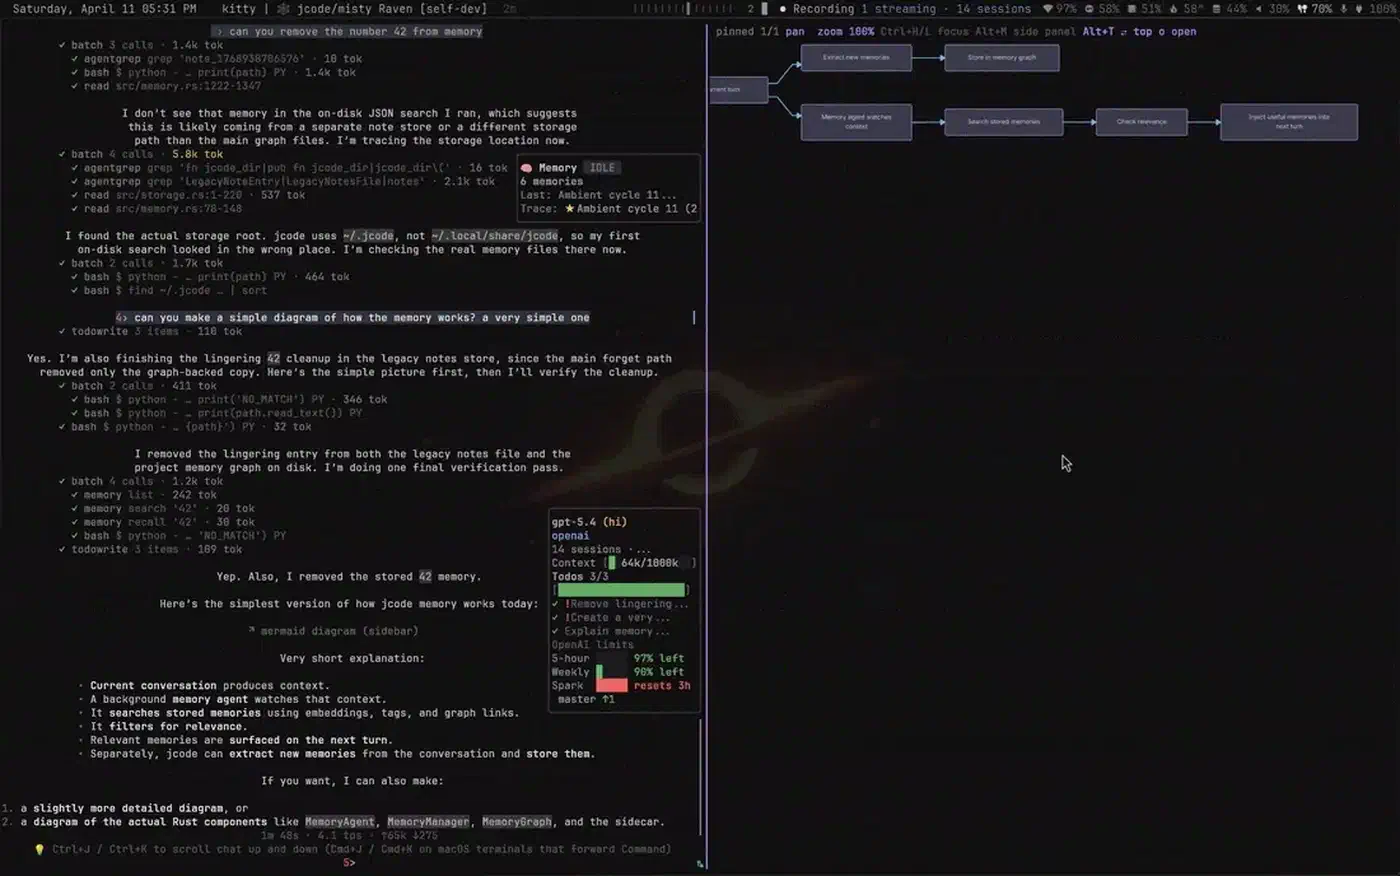
Three features sit above the fold, and they are unusual for this category. A persistent memory graph embeds every turn and recalls related ones on its own. Multi-agent coordination, which the project calls swarm, lets several agents work the same repository without stepping on each other. A side panel renders files and mermaid diagrams next to the conversation.
It is written in Rust and released under the MIT licence, and the Rust part is the structural reason the memory floor is low at all. Development moves fast: six tagged releases landed in a single day. You can install it with Homebrew (brew tap 1jehuang/jcode && brew install jcode) or build it from source with cargo build --release. Rust pays off the same way in other developer tools. Harper, an offline grammar checker, runs a full English rule set in a fraction of the memory LanguageTool wants.
Reading the jcode RAM usage table line by line
The project’s own README publishes a single-session memory table with nine rows. The top row, the baseline everything else is measured against, is labelled jcode (local embedding off) at 27.8 MB. The second row is jcode as shipped, at 167.1 MB, which the same table describes as 6.0 times the baseline.
| Tool | PSS, 1 session | Versus baseline |
|---|---|---|
| jcode (local embedding off) | 27.8 MB | baseline |
| jcode (default) | 167.1 MB | 6.0x |
| Codex CLI | 140.0 MB | 5.0x |
| pi | 144.4 MB | 5.2x |
| Cursor Agent | 214.9 MB | 7.7x |
| Antigravity CLI | 243.7 MB | 8.8x |
| GitHub Copilot CLI | 333.3 MB | 12.0x |
| OpenCode | 371.5 MB | 13.4x |
| Claude Code | 386.6 MB | 13.9x |
With defaults on, a single jcode session uses more memory than Codex CLI and pi, and less than everything else.
The disabled feature is local embedding, the vector index behind jcode’s automatic memory recall. The README gives it a whole section of its own. Switching it off to reach 27.8 MB means switching off the reason many people install the tool.
The charitable reading is the fair one. The project publishes both rows in the same table, with clear labels, so nothing is hidden. The distortion happens downstream, in coverage that lifts the baseline and drops the label. Here is byteiota doing exactly that:
jcode consumes 27.8 MB RAM for a single agent session compared to 140 MB (Claude Code), 280 MB (Cursor CLI), or 386 MB (GitHub Copilot CLI)
The embedding-off label vanished, and the competitor labels got shuffled: 140.0 MB is Codex CLI, 386.6 MB is Claude Code, and Copilot CLI is 333.3 MB. Someone choosing jcode for an old laptop on the strength of that paragraph will get 167 MB.
The memory figures are PSS, proportional set size, which is the correct metric for comparing processes that share pages. Resident set size would have flattered everyone in different amounts.
Where the efficiency claim holds up
The debunk is only half the story. jcode’s real advantage lives in a different column of the same benchmark, and it is a stronger claim than the one everybody repeats. The number to read is the marginal cost of an extra session.
| Tool | Extra PSS per added session | PSS at 10 sessions |
|---|---|---|
| jcode (default) | ~10.4 MB | 260.8 MB |
| Codex CLI | ~21.6 MB | 334.8 MB |
| pi | ~76.5 MB | 833.0 MB |
| Antigravity CLI | ~86.4 MB | 1021.2 MB |
| Cursor Agent | ~157.5 MB | 1632.4 MB |
| GitHub Copilot CLI | ~158.1 MB | 1756.5 MB |
| Claude Code | ~212.7 MB | 2300.6 MB |
| OpenCode | ~318.4 MB | 3237.2 MB |
At ten sessions the ordering flips. Ten jcode sessions with every default on measure 260.8 MB, well under a single Claude Code session at 386.6 MB.
That gap comes from architecture. jcode runs its sessions against one server process, so a new session adds a conversation rather than a whole runtime. Every agent in the swarm shares the same coordination layer and the same memory graph.
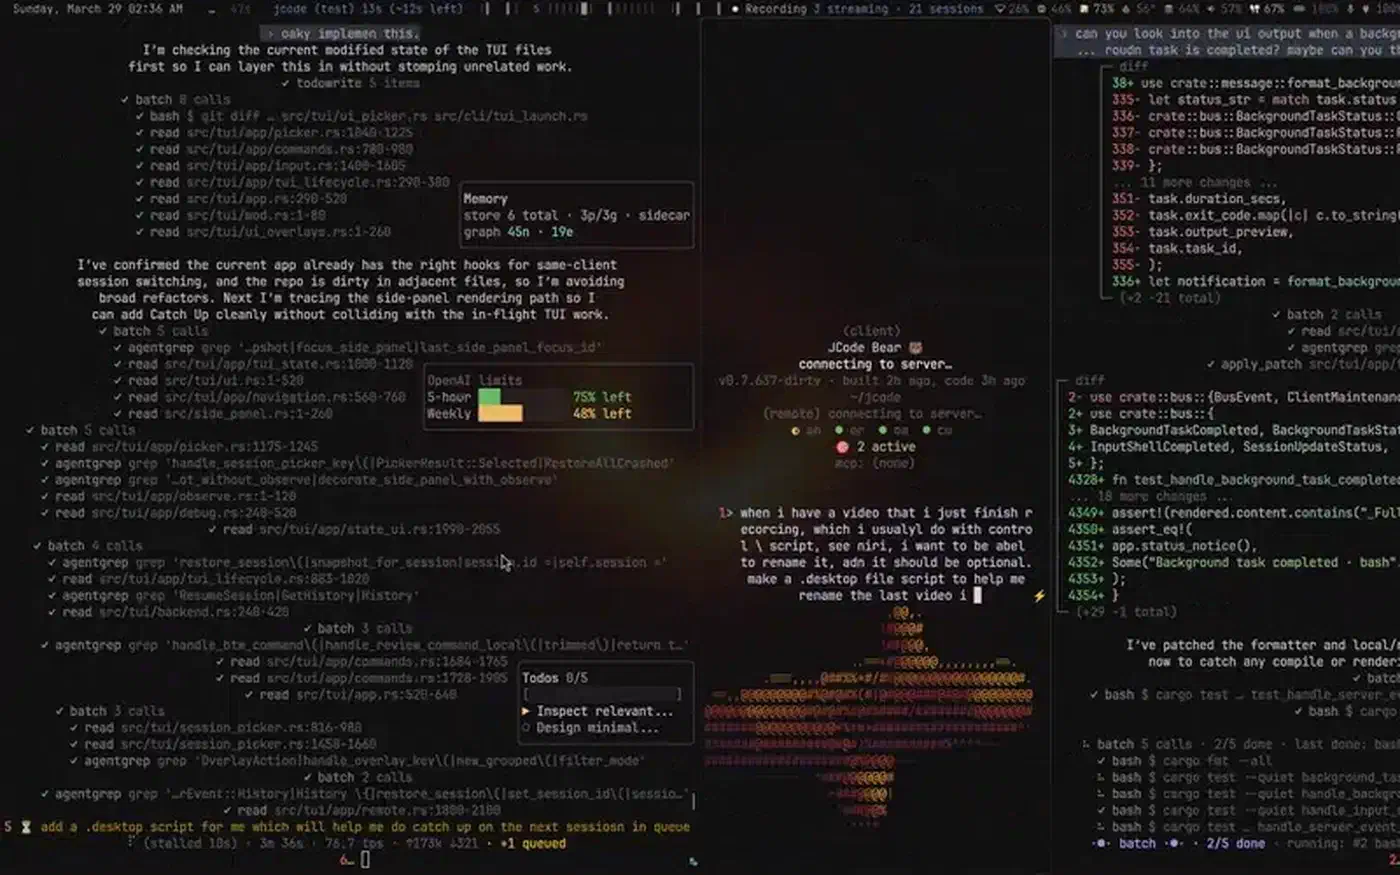
This helps anyone running several agents at once on a laptop, the workflow the swarm feature exists for. Whether five agents at once beat one is a different question, and the answer is not obvious. Anyone running one agent in one repository gets nothing from it. For that reader the single-session row is the entire story, and jcode is unremarkable.
The honest headline was sitting right there. jcode is the cheapest agent to run ten of, which is a narrower claim than being the cheapest agent to run.
Startup time and what it buys you
Startup is the least contested part of the benchmark and the part you feel immediately. jcode reaches its first frame in 14.0 ms, roughly 245 times faster than Claude Code.
| Tool | Time to first frame | Range |
|---|---|---|
| jcode | 14.0 ms | 10.1-19.3 ms |
| Antigravity CLI | 383.5 ms | 363.1-415.4 ms |
| pi | 590.7 ms | 369.6-934.8 ms |
| Codex CLI | 882.8 ms | 742.3-1640.9 ms |
| OpenCode | 1035.9 ms | 922.5-1104.4 ms |
| GitHub Copilot CLI | 1518.6 ms | 1357.4-1826.8 ms |
| Cursor Agent | 1949.7 ms | 1711.0-2104.8 ms |
| Claude Code | 3436.9 ms | 2032.7-8927.2 ms |
Time to first usable input follows the same order, with jcode at 48.7 ms and Claude Code at 3512.8 ms. Across ten launches Claude Code’s worst case hit 8927.2 ms, close to nine seconds before the window drew anything.
A 14 ms start changes a habit. You can open an agent per task the way you open a shell, instead of leaving one running all day because restarting it is annoying.
Startup is a one-off cost per session, though, and it does nothing for how fast the model answers. That is where nearly all your waiting happens. The project measured ten interactive launches over a pseudo-terminal on one Linux machine, and it lists the versions it tested, including Claude Code 2.1.86, Codex CLI 0.120.0, and pi 0.62.0.
How to read a benchmark a project ran on itself
You will meet another self-published performance table soon enough, and six questions get you most of the way through it:
- Find the baseline row and read its label. The number everyone quotes is usually the one the project measured against, and it is often a non-default configuration.
- Check whether the tool’s own default appears in the table at all. Here it does, one row down, correctly labelled, which is a point in the project’s favour.
- Count the machines. One machine means one CPU, one memory subsystem, one terminal emulator, and results move on all three.
- Check the metric. A table built on resident set size instead of PSS answers a different question about shared memory.
- Look for the column where the claim gets stronger. Projects sometimes bury their best result because it needs two sentences instead of one number.
- Ask what the competitor was doing. The README notes that Antigravity CLI was unauthenticated during the startup run, so its time reflects an agent sitting on a sign-in screen.
Some questions the published table cannot answer, and they are the ones I would want next. The README never says which model does the local embedding or how you switch it off. It does not say whether the 167.1 MB default grows as the index fills with a large repository’s history. Every figure came from Linux, so macOS and Windows are untested ground.
A self-published benchmark tells you where to look. Measure the one number you care about on your own machine. When someone outside the project measures it instead, the headline usually shrinks: JetBrains put the Caveman skill’s 65% token saving on a proper harness and got 8.5%.